
 Yahoo Finance
 Should You Be Tempted To Sell Downer EDI Limited (ASX:DOW) Because Of Its P/E Ratio?

Want to participate in a research study? Help shape the future of investing tools and earn a $60 gift card!
The goal of this article is to teach you how to use price to earnings ratios (P/E ratios). We'll show how you can use Downer EDI Limited's (ASX:DOW) P/E ratio to inform your assessment of the investment opportunity. Downer EDI has a P/E ratio of 21.61, based on the last twelve months. That means that at current prices, buyers pay A$21.61 for every A$1 in trailing yearly profits.
See our latest analysis for Downer EDI
How Do You Calculate A P/E Ratio?
The formula for P/E is:
Price to Earnings Ratio = Price per Share ÷ Earnings per Share (EPS)
Or for Downer EDI:
P/E of 21.61 = A$7.63 ÷ A$0.35 (Based on the year to December 2018.)
Is A High Price-to-Earnings Ratio Good?
A higher P/E ratio means that buyers have to pay a higher price for each A$1 the company has earned over the last year. All else being equal, it's better to pay a low price -- but as Warren Buffett said, 'It's far better to buy a wonderful company at a fair price than a fair company at a wonderful price.'
How Growth Rates Impact P/E Ratios
If earnings fall then in the future the 'E' will be lower. Therefore, even if you pay a low multiple of earnings now, that multiple will become higher in the future. So while a stock may look cheap based on past earnings, it could be expensive based on future earnings.
Downer EDI increased earnings per share by a whopping 134% last year. In contrast, EPS has decreased by 18%, annually, over 5 years.
How Does Downer EDI's P/E Ratio Compare To Its Peers?
We can get an indication of market expectations by looking at the P/E ratio. The image below shows that Downer EDI has a P/E ratio that is roughly in line with the commercial services industry average (20.7).
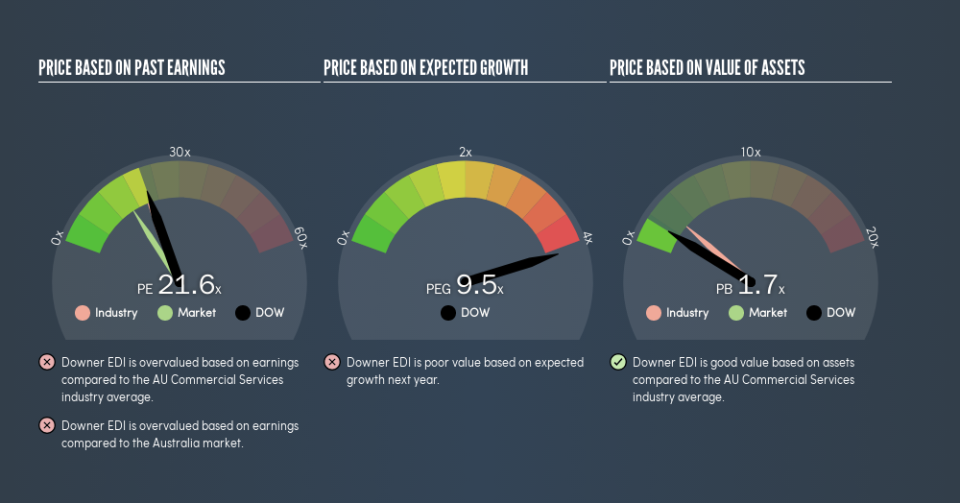
That indicates that the market expects Downer EDI will perform roughly in line with other companies in its industry. So if Downer EDI actually outperforms its peers going forward, that should be a positive for the share price. Further research into factors such asmanagement tenure, could help you form your own view on whether that is likely.
Remember: P/E Ratios Don't Consider The Balance Sheet
It's important to note that the P/E ratio considers the market capitalization, not the enterprise value. Thus, the metric does not reflect cash or debt held by the company. Theoretically, a business can improve its earnings (and produce a lower P/E in the future), by taking on debt (or spending its remaining cash).
Such spending might be good or bad, overall, but the key point here is that you need to look at debt to understand the P/E ratio in context.
How Does Downer EDI's Debt Impact Its P/E Ratio?
Downer EDI's net debt is 20% of its market cap. This could bring some additional risk, and reduce the number of investment options for management; worth remembering if you compare its P/E to businesses without debt.
The Verdict On Downer EDI's P/E Ratio
Downer EDI has a P/E of 21.6. That's higher than the average in the AU market, which is 16. While the company does use modest debt, its recent earnings growth is impressive. So it does not seem strange that the P/E is above average.
Investors should be looking to buy stocks that the market is wrong about. As value investor Benjamin Graham famously said, 'In the short run, the market is a voting machine but in the long run, it is a weighing machine.' So this free report on the analyst consensus forecasts could help you make a master move on this stock.
Of course you might be able to find a better stock than Downer EDI. So you may wish to see this free collection of other companies that have grown earnings strongly.
We aim to bring you long-term focused research analysis driven by fundamental data. Note that our analysis may not factor in the latest price-sensitive company announcements or qualitative material.
If you spot an error that warrants correction, please contact the editor at editorial-team@simplywallst.com. This article by Simply Wall St is general in nature. It does not constitute a recommendation to buy or sell any stock, and does not take account of your objectives, or your financial situation. Simply Wall St has no position in the stocks mentioned. Thank you for reading.
