
 Yahoo Finance
 Should You Be Tempted To Sell Arcosa, Inc. (NYSE:ACA) Because Of Its P/E Ratio?

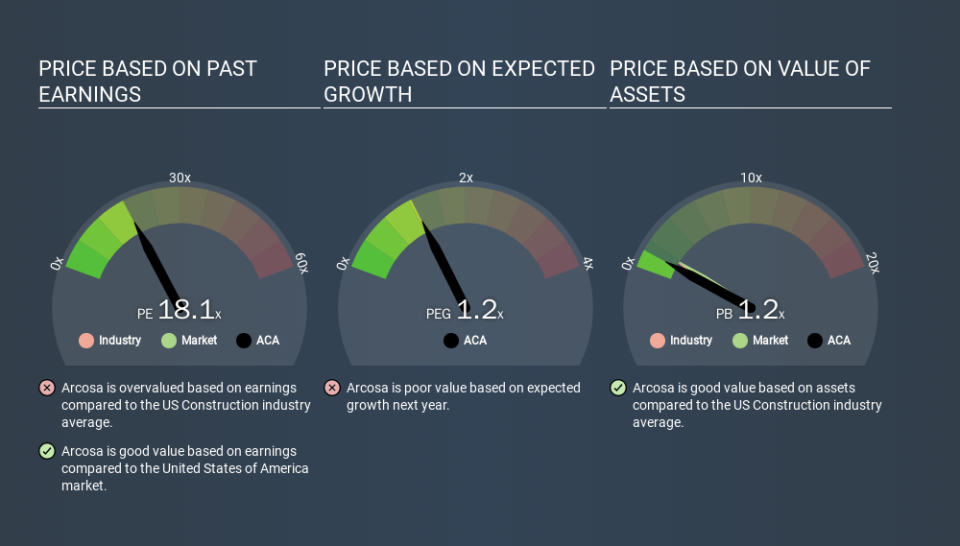
This article is written for those who want to get better at using price to earnings ratios (P/E ratios). We'll apply a basic P/E ratio analysis to Arcosa, Inc.'s (NYSE:ACA), to help you decide if the stock is worth further research. Arcosa has a price to earnings ratio of 18.12, based on the last twelve months. That means that at current prices, buyers pay $18.12 for every $1 in trailing yearly profits.
View our latest analysis for Arcosa
How Do I Calculate A Price To Earnings Ratio?
The formula for P/E is:
Price to Earnings Ratio = Share Price ÷ Earnings per Share (EPS)
Or for Arcosa:
P/E of 18.12 = USD44.76 ÷ USD2.47 (Based on the trailing twelve months to September 2019.)
Is A High P/E Ratio Good?
The higher the P/E ratio, the higher the price tag of a business, relative to its trailing earnings. That isn't necessarily good or bad, but a high P/E implies relatively high expectations of what a company can achieve in the future.
Does Arcosa Have A Relatively High Or Low P/E For Its Industry?
The P/E ratio indicates whether the market has higher or lower expectations of a company. As you can see below Arcosa has a P/E ratio that is fairly close for the average for the construction industry, which is 17.7.
Its P/E ratio suggests that Arcosa shareholders think that in the future it will perform about the same as other companies in its industry classification. So if Arcosa actually outperforms its peers going forward, that should be a positive for the share price. Checking factors such as director buying and selling. could help you form your own view on if that will happen.
How Growth Rates Impact P/E Ratios
When earnings fall, the 'E' decreases, over time. That means unless the share price falls, the P/E will increase in a few years. A higher P/E should indicate the stock is expensive relative to others -- and that may encourage shareholders to sell.
Arcosa's 68% EPS improvement over the last year was like bamboo growth after rain; rapid and impressive.
Remember: P/E Ratios Don't Consider The Balance Sheet
It's important to note that the P/E ratio considers the market capitalization, not the enterprise value. In other words, it does not consider any debt or cash that the company may have on the balance sheet. Theoretically, a business can improve its earnings (and produce a lower P/E in the future) by investing in growth. That means taking on debt (or spending its cash).
While growth expenditure doesn't always pay off, the point is that it is a good option to have; but one that the P/E ratio ignores.
So What Does Arcosa's Balance Sheet Tell Us?
The extra options and safety that comes with Arcosa's US$22m net cash position means that it deserves a higher P/E than it would if it had a lot of net debt.
The Verdict On Arcosa's P/E Ratio
Arcosa trades on a P/E ratio of 18.1, which is fairly close to the US market average of 18.4. Its net cash position is the cherry on top of its superb EPS growth. So based on this analysis we'd expect Arcosa to have a higher P/E ratio.
Investors should be looking to buy stocks that the market is wrong about. If the reality for a company is not as bad as the P/E ratio indicates, then the share price should increase as the market realizes this. So this free visual report on analyst forecasts could hold the key to an excellent investment decision.
You might be able to find a better buy than Arcosa. If you want a selection of possible winners, check out this free list of interesting companies that trade on a P/E below 20 (but have proven they can grow earnings).
If you spot an error that warrants correction, please contact the editor at editorial-team@simplywallst.com. This article by Simply Wall St is general in nature. It does not constitute a recommendation to buy or sell any stock, and does not take account of your objectives, or your financial situation. Simply Wall St has no position in the stocks mentioned.
We aim to bring you long-term focused research analysis driven by fundamental data. Note that our analysis may not factor in the latest price-sensitive company announcements or qualitative material. Thank you for reading.
