
 Yahoo Finance
 Is Temple & Webster Group Ltd's (ASX:TPW) Stock's Recent Performance Being Led By Its Attractive Financial Prospects?
Temple & Webster Group's (ASX:TPW) stock is up by a considerable 8.0% over the past month. Given the company's impressive performance, we decided to study its financial indicators more closely as a company's financial health over the long-term usually dictates market outcomes. In this article, we decided to focus on Temple & Webster Group's ROE.
ROE or return on equity is a useful tool to assess how effectively a company can generate returns on the investment it received from its shareholders. Put another way, it reveals the company's success at turning shareholder investments into profits.
View our latest analysis for Temple & Webster Group
How To Calculate Return On Equity?
ROE can be calculated by using the formula:
Return on Equity = Net Profit (from continuing operations) ÷ Shareholders' Equity
So, based on the above formula, the ROE for Temple & Webster Group is:
29% = AU$23m ÷ AU$81m (Based on the trailing twelve months to December 2020).
The 'return' refers to a company's earnings over the last year. Another way to think of that is that for every A$1 worth of equity, the company was able to earn A$0.29 in profit.
What Is The Relationship Between ROE And Earnings Growth?
Thus far, we have learned that ROE measures how efficiently a company is generating its profits. We now need to evaluate how much profit the company reinvests or "retains" for future growth which then gives us an idea about the growth potential of the company. Assuming all else is equal, companies that have both a higher return on equity and higher profit retention are usually the ones that have a higher growth rate when compared to companies that don't have the same features.
Temple & Webster Group's Earnings Growth And 29% ROE
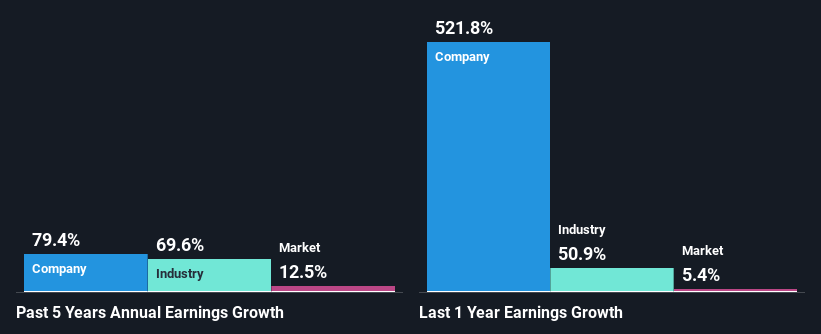
First thing first, we like that Temple & Webster Group has an impressive ROE. Even when compared to the industry average of 25% the company's ROE is pretty decent. Given the circumstances, the significant 79% net income growth seen by Temple & Webster Group over the last five years is not surprising.
We then performed a comparison between Temple & Webster Group's net income growth with the industry, which revealed that the company's growth is similar to the average industry growth of 70% in the same period.
Earnings growth is a huge factor in stock valuation. The investor should try to establish if the expected growth or decline in earnings, whichever the case may be, is priced in. This then helps them determine if the stock is placed for a bright or bleak future. Is Temple & Webster Group fairly valued compared to other companies? These 3 valuation measures might help you decide.
Is Temple & Webster Group Efficiently Re-investing Its Profits?
Summary
Overall, we are quite pleased with Temple & Webster Group's performance. Specifically, we like that the company is reinvesting a huge chunk of its profits at a high rate of return. This of course has caused the company to see substantial growth in its earnings. That being so, a study of the latest analyst forecasts show that the company is expected to see a slowdown in its future earnings growth. Are these analysts expectations based on the broad expectations for the industry, or on the company's fundamentals? Click here to be taken to our analyst's forecasts page for the company.
This article by Simply Wall St is general in nature. It does not constitute a recommendation to buy or sell any stock, and does not take account of your objectives, or your financial situation. We aim to bring you long-term focused analysis driven by fundamental data. Note that our analysis may not factor in the latest price-sensitive company announcements or qualitative material. Simply Wall St has no position in any stocks mentioned.
Have feedback on this article? Concerned about the content? Get in touch with us directly. Alternatively, email editorial-team (at) simplywallst.com.
