
 Yahoo Finance
 Telstra Group Limited (ASX:TLS) On An Uptrend: Could Fundamentals Be Driving The Stock?
Telstra Group's (ASX:TLS) stock is up by 5.8% over the past three months. Given that stock prices are usually aligned with a company's financial performance in the long-term, we decided to investigate if the company's decent financials had a hand to play in the recent price move. Particularly, we will be paying attention to Telstra Group's ROE today.
Return on equity or ROE is a key measure used to assess how efficiently a company's management is utilizing the company's capital. Put another way, it reveals the company's success at turning shareholder investments into profits.
See our latest analysis for Telstra Group
How Do You Calculate Return On Equity?
The formula for ROE is:
Return on Equity = Net Profit (from continuing operations) ÷ Shareholders' Equity
So, based on the above formula, the ROE for Telstra Group is:
11% = AU$2.0b ÷ AU$18b (Based on the trailing twelve months to December 2022).
The 'return' is the yearly profit. Another way to think of that is that for every A$1 worth of equity, the company was able to earn A$0.11 in profit.
What Is The Relationship Between ROE And Earnings Growth?
We have already established that ROE serves as an efficient profit-generating gauge for a company's future earnings. Depending on how much of these profits the company reinvests or "retains", and how effectively it does so, we are then able to assess a company’s earnings growth potential. Assuming everything else remains unchanged, the higher the ROE and profit retention, the higher the growth rate of a company compared to companies that don't necessarily bear these characteristics.
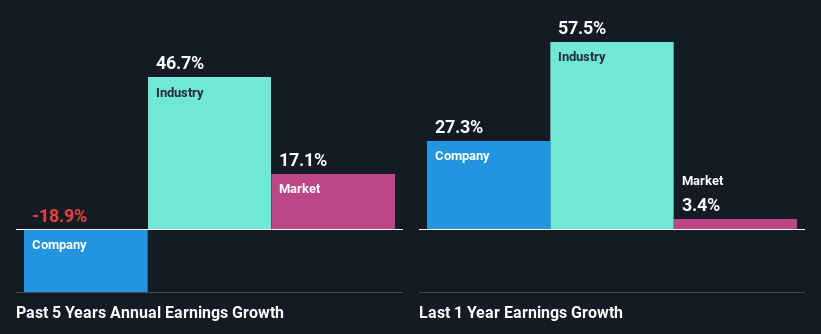
A Side By Side comparison of Telstra Group's Earnings Growth And 11% ROE
To start with, Telstra Group's ROE looks acceptable. Further, the company's ROE compares quite favorably to the industry average of 5.4%. Needless to say, we are quite surprised to see that Telstra Group's net income shrunk at a rate of 19% over the past five years. Based on this, we feel that there might be other reasons which haven't been discussed so far in this article that could be hampering the company's growth. For example, it could be that the company has a high payout ratio or the business has allocated capital poorly, for instance.
That being said, we compared Telstra Group's performance with the industry and were concerned when we found that while the company has shrunk its earnings, the industry has grown its earnings at a rate of 47% in the same period.
The basis for attaching value to a company is, to a great extent, tied to its earnings growth. What investors need to determine next is if the expected earnings growth, or the lack of it, is already built into the share price. By doing so, they will have an idea if the stock is headed into clear blue waters or if swampy waters await. Is Telstra Group fairly valued compared to other companies? These 3 valuation measures might help you decide.
Is Telstra Group Making Efficient Use Of Its Profits?
Telstra Group has a high three-year median payout ratio of 67% (that is, it is retaining 33% of its profits). This suggests that the company is paying most of its profits as dividends to its shareholders. This goes some way in explaining why its earnings have been shrinking. With only a little being reinvested into the business, earnings growth would obviously be low or non-existent. You can see the 2 risks we have identified for Telstra Group by visiting our risks dashboard for free on our platform here.
Additionally, Telstra Group has paid dividends over a period of at least ten years, which means that the company's management is determined to pay dividends even if it means little to no earnings growth. Looking at the current analyst consensus data, we can see that the company's future payout ratio is expected to rise to 96% over the next three years. Still, forecasts suggest that Telstra Group's future ROE will rise to 15% even though the the company's payout ratio is expected to rise. We presume that there could some other characteristics of the business that could be driving the anticipated growth in the company's ROE.
Summary
Overall, we feel that Telstra Group certainly does have some positive factors to consider. However, while the company does have a high ROE, its earnings growth number is quite disappointing. This can be blamed on the fact that it reinvests only a small portion of its profits and pays out the rest as dividends. Having said that, looking at current analyst estimates, we found that the company's earnings growth rate is expected to see a huge improvement. To know more about the company's future earnings growth forecasts take a look at this free report on analyst forecasts for the company to find out more.
Have feedback on this article? Concerned about the content? Get in touch with us directly. Alternatively, email editorial-team (at) simplywallst.com.
This article by Simply Wall St is general in nature. We provide commentary based on historical data and analyst forecasts only using an unbiased methodology and our articles are not intended to be financial advice. It does not constitute a recommendation to buy or sell any stock, and does not take account of your objectives, or your financial situation. We aim to bring you long-term focused analysis driven by fundamental data. Note that our analysis may not factor in the latest price-sensitive company announcements or qualitative material. Simply Wall St has no position in any stocks mentioned.
Join A Paid User Research Session
You’ll receive a US$30 Amazon Gift card for 1 hour of your time while helping us build better investing tools for the individual investors like yourself. Sign up here
