
 Yahoo Finance
 TC Energy (TSE:TRP) Is Increasing Its Dividend To CA$0.93
The board of TC Energy Corporation (TSE:TRP) has announced that it will be paying its dividend of CA$0.93 on the 31st of July, an increased payment from last year's comparable dividend. This takes the dividend yield to 6.7%, which shareholders will be pleased with.
See our latest analysis for TC Energy
TC Energy's Earnings Easily Cover The Distributions
Impressive dividend yields are good, but this doesn't matter much if the payments can't be sustained. Before this announcement, TC Energy was paying out 229% of what it was earning, and not generating any free cash flows either. Paying out such a large dividend compared to earnings while also not generating any free cash flow would definitely be difficult to keep up.
Earnings per share is forecast to rise exponentially over the next year. If the dividend continues along recent trends, we believe we could see the payout ratio reaching 83%, which is definitely on the higher side, but still sustainable.
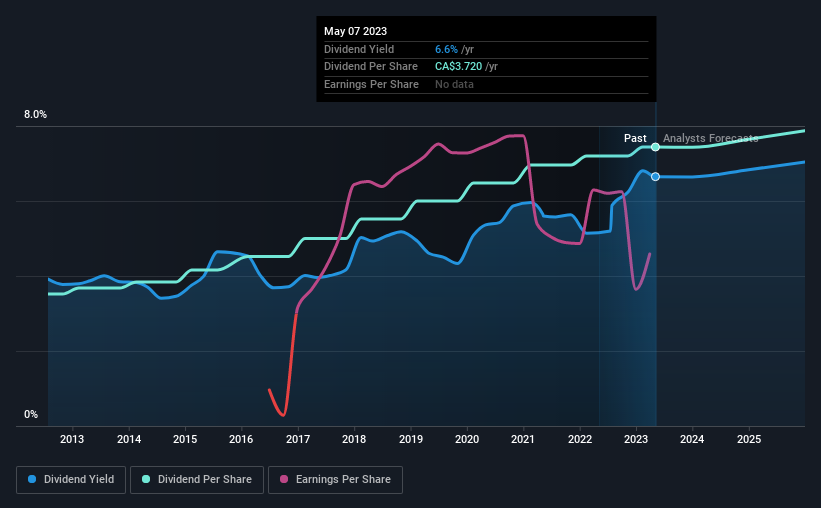
TC Energy Has A Solid Track Record
The company has an extended history of paying stable dividends. The annual payment during the last 10 years was CA$1.76 in 2013, and the most recent fiscal year payment was CA$3.72. This works out to be a compound annual growth rate (CAGR) of approximately 7.8% a year over that time. Dividends have grown at a reasonable rate over this period, and without any major cuts in the payment over time, we think this is an attractive combination as it provides a nice boost to shareholder returns.
Dividend Growth Potential Is Shaky
Investors who have held shares in the company for the past few years will be happy with the dividend income they have received. Let's not jump to conclusions as things might not be as good as they appear on the surface. TC Energy's EPS has fallen by approximately 15% per year during the past five years. Such rapid declines definitely have the potential to constrain dividend payments if the trend continues into the future. However, the next year is actually looking up, with earnings set to rise. We would just wait until it becomes a pattern before getting too excited.
The Dividend Could Prove To Be Unreliable
Overall, this is probably not a great income stock, even though the dividend is being raised at the moment. Although they have been consistent in the past, we think the payments are a little high to be sustained. This company is not in the top tier of income providing stocks.
Investors generally tend to favour companies with a consistent, stable dividend policy as opposed to those operating an irregular one. However, there are other things to consider for investors when analysing stock performance. To that end, TC Energy has 5 warning signs (and 2 which are concerning) we think you should know about. Is TC Energy not quite the opportunity you were looking for? Why not check out our selection of top dividend stocks.
Have feedback on this article? Concerned about the content? Get in touch with us directly. Alternatively, email editorial-team (at) simplywallst.com.
This article by Simply Wall St is general in nature. We provide commentary based on historical data and analyst forecasts only using an unbiased methodology and our articles are not intended to be financial advice. It does not constitute a recommendation to buy or sell any stock, and does not take account of your objectives, or your financial situation. We aim to bring you long-term focused analysis driven by fundamental data. Note that our analysis may not factor in the latest price-sensitive company announcements or qualitative material. Simply Wall St has no position in any stocks mentioned.
Join A Paid User Research Session
You’ll receive a US$30 Amazon Gift card for 1 hour of your time while helping us build better investing tools for the individual investors like yourself. Sign up here
