T. Rowe Price (TROW) Q3 Earnings Top Estimates, AUM Escalates
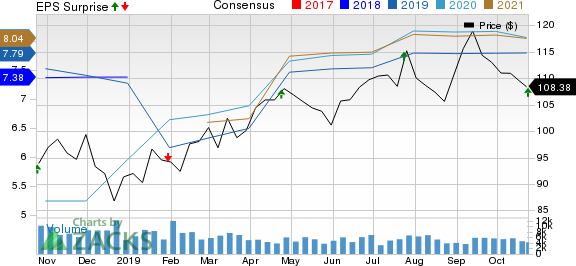
T. Rowe Price Group, Inc. TROW reported a positive earnings surprise of 7.6% in third-quarter 2019. Adjusted earnings per share came in at $2.13, outpacing the Zacks Consensus Estimate of $1.98. Results also improved 7% from the year-ago figure of $1.99.
Results were driven by higher assets under management (AUM) and revenues. However, escalating expenses were an undermining factor.
Including certain non-recurring items, net income came in at $545.9 million or $2.23 per share compared with $583 million or $2.30 per share recorded in the prior-year quarter.
Revenues Up Y/Y, Expenses Flare Up
Net revenues in the third quarter increased 2.3% to $1.43 billion from the year-ago quarter. This upside primarily resulted from higher investment advisory fees, partly offset by lower administrative, distribution and servicing fees. The net revenue figure missed the Zacks Consensus Estimate of $1.44 billion.
Investment advisory fees climbed 3.2% year over year. However, administrative, distribution and servicing fees declined 6.1% year over year to $123.3 million.
Investment advisory revenues earned from the T. Rowe Price mutual funds, distributed in the United States, were up 0.4% year over year to $881 million. Investment advisory revenues earned from other investment portfolios, managed by the company, increased 9.4% from the prior-year quarter to $422.4 million.
Total adjusted operating expenses flared up 2.8% year over year to $765.1 million in the third quarter. Rise in compensation and related costs, technology, occupancy, and facility costs along with higher general, administrative, and other expenses resulted in this upsurge. Including certain one-time items, expenses were $767.6 million, up 1.8%.
As of Sep 30, 2019, T. Rowe Price employed 7,262 associates, around 3.3% higher than the last year.
Strong Assets Position
As of Sep 30, 2019, total AUM climbed 3.9% year over year to $1.13 trillion. During the July-September quarter, net market depreciation and income, came in at $1 billion, while net cash inflow was $2.5 billion after client transfers.
T. Rowe Price remains debt free with substantial liquidity, including cash and sponsored portfolio investment holdings of about $5.6 billion as of Sep 30, 2019, which enable the company to keep on investing.
Capital-Deployment Activity
During third-quarter 2019, T. Rowe Price repurchased 1.6 million shares of its common stock for $173.1 million, and invested $148.9 million in capitalized technology and facilities using available cash balances in the first nine months of 2019.
For 2019, the company projects capital expenditures at approximately $200 million, comprising two-third for technology development.
Outlook
T. Rowe Price has updated full-year 2019 non-GAAP operating expense growth guidance to 4-5% from the prior range of 4-7%. This is mainly due to lower-than-planned year-to-date distribution, product-related and professional fee expenses, along with headcount growth.
Our Viewpoint
T. Rowe Price witnessed an impressive quarter with stellar revenues. The company’s financial stability has the potential to benefit from growth opportunities in domestic and global AUM. The company’s debt-free position, higher return on earnings and improvement in investor sentiment, as a whole, makes us confident of its robust fundamentals. Furthermore, a relatively better mutual fund performance is a positive.
Nonetheless, higher operating expenses are a concern.
T. Rowe Price Group, Inc. Price, Consensus and EPS Surprise

T. Rowe Price Group, Inc. price-consensus-eps-surprise-chart | T. Rowe Price Group, Inc. Quote
Currently, T. Rowe Price carries a Zacks Rank #3 (Hold). You can see the complete list of today’s Zacks #1 Rank (Strong Buy) stocks here.
Among other investment managers, BlackRock, Inc.’s BLK third-quarter 2019 adjusted earnings of $7.15 per share surpassed the Zacks Consensus Estimate of $6.95. However, the figure was 4.9% lower than the year-ago quarter’s number. Results benefited from an improvement in revenues. Moreover, growth in AUM, driven by net inflows, was a positive. However, higher expenses hurt results to some extent.
Franklin Resources, Inc. BEN and Lazard LAZ will release their quarterly numbers on Oct 25 and Oct 31, respectively.
Today's Best Stocks from Zacks
Would you like to see the updated picks from our best market-beating strategies? From 2017 through 2018, while the S&P 500 gained +15.8%, five of our screens returned +38.0%, +61.3%, +61.6%, +68.1%, and +98.3%.
This outperformance has not just been a recent phenomenon. From 2000 – 2018, while the S&P averaged +4.8% per year, our top strategies averaged up to +56.2% per year.
See their latest picks free >>
Want the latest recommendations from Zacks Investment Research? Today, you can download 7 Best Stocks for the Next 30 Days. Click to get this free report
Lazard Ltd (LAZ) : Free Stock Analysis Report
Franklin Resources, Inc. (BEN) : Free Stock Analysis Report
T. Rowe Price Group, Inc. (TROW) : Free Stock Analysis Report
BlackRock, Inc. (BLK) : Free Stock Analysis Report
To read this article on Zacks.com click here.
Zacks Investment Research

 Yahoo Finance