
 Yahoo Finance
 T. Rowe Price (TROW) Q1 Earnings Beat Estimates, AUM Rises Y/Y
T. Rowe Price Group, Inc. TROW has reported first-quarter 2024 adjusted earnings per share of $2.38, which outpaced the Zacks Consensus Estimate of $2.01. Also, the bottom line increased 40.8% year over year.
TROW's net revenues were supported by a rise in assets under management (AUM). A decline in expenses aided bottom-line growth. Further, appreciation in cash and cash equivalents will help the company to continue investing.
Net income attributable to T. Rowe Price was $573.8 million, up 36.1% year over year.
Revenues Increase, Expenses Decline
Net revenues in the first quarter increased 7.7% year over year to $1.64 billion. The top line missed the Zacks Consensus Estimate of $1.71 billion.
Also, investment advisory fees increased 11.7% year over year to $1.55 billion. Capital allocation-based income jumped significantly to $47.1 million. We projected investment advisory fees and capital allocation-based income of $1.45 billion and $72.3 million, respectively.
Total operating expenses decreased 10.5% to $1.16 billion in the reported quarter. Our estimate for the metric was $1.20 billion.
As of Mar 31, 2024, T. Rowe Price employed 7,878 associates, up 0.5% year over year.
AUM Rises, Liquidity Position Strong
As of Mar 31, 2024, the total AUM grew 14.9% year over year to $1.54 trillion. Our projection was at $1.49 billion.
In the first quarter, net market appreciation and gains of $105.7 billion positively impacted TROW’s AUM. However, net cash outflows were $8 billion.
The company had substantial liquidity, including cash and cash equivalents of $2.42 billion as of Mar 31, 2024, up from $2.06 billion as of Dec 31, 2023. This will enable TROW to keep investing.
Our View
T. Rowe Price’s diversified business model, focus on enhancing investment capabilities, broadening distribution reach and improving client partnerships will aid long-term growth. An escalation in AUM in the first quarter acted as another positive.
T. Rowe Price Group, Inc. Price, Consensus and EPS Surprise
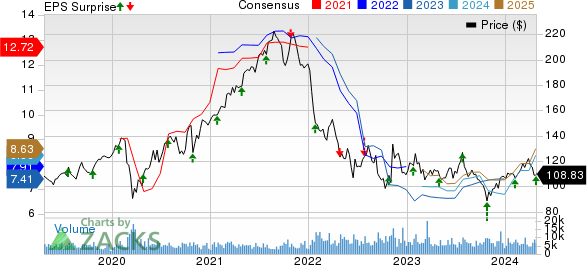
T. Rowe Price Group, Inc. price-consensus-eps-surprise-chart | T. Rowe Price Group, Inc. Quote
Currently, TROW flaunts a Zacks Rank #1 (Strong Buy). You can see the complete list of today’s Zacks #1 Rank stocks here.
Performance of Other Asset Managers
BlackRock, Inc.’s BLK first-quarter 2024 adjusted earnings of $9.81 per share handily surpassed the Zacks Consensus Estimate of $9.42. The figure reflects a jump of 24% from the year-ago quarter.
BLK’s results benefited from a rise in revenues and higher non-operating income. Further, the AUM balance witnessed an improvement, driven by net inflows. However, higher expenses acted as a dampener.
Invesco’s IVZ first-quarter 2024 adjusted earnings of 33 cents per share lagged the Zacks Consensus Estimate of 40 cents. The bottom line declined 13.2% from the prior-year quarter.
IVZ’s results were primarily hurt by a decline in adjusted revenues, along with higher adjusted expenses. However, an increase in the AUM balance on decent inflows was a positive.
Want the latest recommendations from Zacks Investment Research? Today, you can download 7 Best Stocks for the Next 30 Days. Click to get this free report
BlackRock, Inc. (BLK) : Free Stock Analysis Report
T. Rowe Price Group, Inc. (TROW) : Free Stock Analysis Report
Invesco Ltd. (IVZ) : Free Stock Analysis Report
