
 Yahoo Finance
 Super Retail Group (ASX:SUL) Is Very Good At Capital Allocation
If you're not sure where to start when looking for the next multi-bagger, there are a few key trends you should keep an eye out for. Firstly, we'll want to see a proven return on capital employed (ROCE) that is increasing, and secondly, an expanding base of capital employed. Basically this means that a company has profitable initiatives that it can continue to reinvest in, which is a trait of a compounding machine. So when we looked at the ROCE trend of Super Retail Group (ASX:SUL) we really liked what we saw.
What is Return On Capital Employed (ROCE)?
If you haven't worked with ROCE before, it measures the 'return' (pre-tax profit) a company generates from capital employed in its business. The formula for this calculation on Super Retail Group is:
Return on Capital Employed = Earnings Before Interest and Tax (EBIT) ÷ (Total Assets - Current Liabilities)
0.23 = AU$469m ÷ (AU$3.0b - AU$924m) (Based on the trailing twelve months to June 2021).
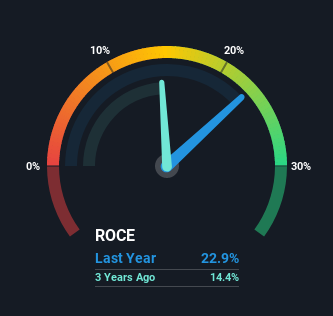
So, Super Retail Group has an ROCE of 23%. That's a fantastic return and not only that, it outpaces the average of 18% earned by companies in a similar industry.
See our latest analysis for Super Retail Group
In the above chart we have measured Super Retail Group's prior ROCE against its prior performance, but the future is arguably more important. If you'd like, you can check out the forecasts from the analysts covering Super Retail Group here for free.
What Can We Tell From Super Retail Group's ROCE Trend?
The trends we've noticed at Super Retail Group are quite reassuring. The numbers show that in the last five years, the returns generated on capital employed have grown considerably to 23%. The amount of capital employed has increased too, by 65%. So we're very much inspired by what we're seeing at Super Retail Group thanks to its ability to profitably reinvest capital.
On a side note, we noticed that the improvement in ROCE appears to be partly fueled by an increase in current liabilities. Essentially the business now has suppliers or short-term creditors funding about 31% of its operations, which isn't ideal. Keep an eye out for future increases because when the ratio of current liabilities to total assets gets particularly high, this can introduce some new risks for the business.
The Bottom Line
To sum it up, Super Retail Group has proven it can reinvest in the business and generate higher returns on that capital employed, which is terrific. Since the stock has returned a solid 50% to shareholders over the last five years, it's fair to say investors are beginning to recognize these changes. Therefore, we think it would be worth your time to check if these trends are going to continue.
One final note, you should learn about the 2 warning signs we've spotted with Super Retail Group (including 1 which doesn't sit too well with us) .
If you want to search for more stocks that have been earning high returns, check out this free list of stocks with solid balance sheets that are also earning high returns on equity.
This article by Simply Wall St is general in nature. We provide commentary based on historical data and analyst forecasts only using an unbiased methodology and our articles are not intended to be financial advice. It does not constitute a recommendation to buy or sell any stock, and does not take account of your objectives, or your financial situation. We aim to bring you long-term focused analysis driven by fundamental data. Note that our analysis may not factor in the latest price-sensitive company announcements or qualitative material. Simply Wall St has no position in any stocks mentioned.
Have feedback on this article? Concerned about the content? Get in touch with us directly. Alternatively, email editorial-team (at) simplywallst.com.
