
 Yahoo Finance
 SunLink Health Systems Inc (NYSEMKT:SSY): Time For A Financial Health Check

Investors are always looking for growth in small-cap stocks like SunLink Health Systems Inc (AMEX:SSY), with a market cap of US$9.86M. However, an important fact which most ignore is: how financially healthy is the business? Companies operating in the Healthcare industry, especially ones that are currently loss-making, are more likely to be higher risk. Evaluating financial health as part of your investment thesis is vital. Here are few basic financial health checks you should consider before taking the plunge. However, since I only look at basic financial figures, I recommend you dig deeper yourself into SSY here.
Does SSY generate enough cash through operations?
Over the past year, SSY has reduced its debt from US$10.45M to US$6.71M , which comprises of short- and long-term debt. With this debt payback, SSY currently has US$10.49M remaining in cash and short-term investments , ready to deploy into the business. Moving onto cash from operations, its operating cash flow is not yet significant enough to calculate a meaningful cash-to-debt ratio, indicating that operational efficiency is something we’d need to take a look at. For this article’s sake, I won’t be looking at this today, but you can examine some of SSY’s operating efficiency ratios such as ROA here.
Can SSY meet its short-term obligations with the cash in hand?
Looking at SSY’s most recent US$12.31M liabilities, it seems that the business has been able to meet these commitments with a current assets level of US$22.62M, leading to a 1.84x current account ratio. Usually, for Healthcare companies, this is a suitable ratio since there is a bit of a cash buffer without leaving too much capital in a low-return environment.
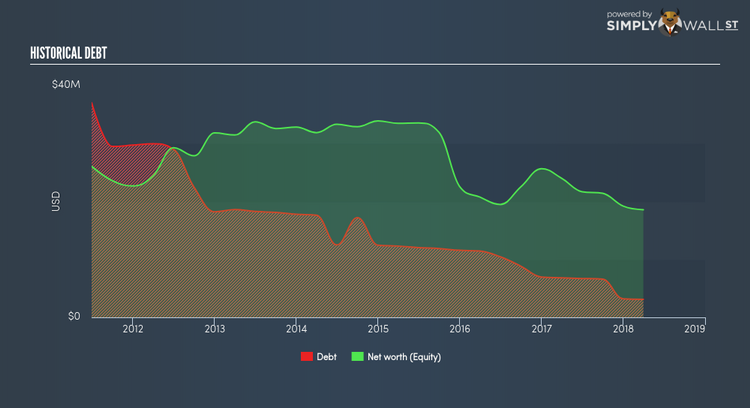
Can SSY service its debt comfortably?
With debt at 16.79% of equity, SSY may be thought of as appropriately levered. SSY is not taking on too much debt commitment, which can be restrictive and risky for equity-holders. SSY’s risk around capital structure is low, and the company has the headroom and ability to raise debt should it need to in the future.
Next Steps:
Although SSY’s debt level is relatively low, its cash flow levels still could not copiously cover its borrowings. This may indicate room for improvement in terms of its operating efficiency. However, the company will be able to pay all of its upcoming liabilities from its current short-term assets. I admit this is a fairly basic analysis for SSY’s financial health. Other important fundamentals need to be considered alongside. You should continue to research SunLink Health Systems to get a better picture of the stock by looking at:
Historical Performance: What has SSY’s returns been like over the past? Go into more detail in the past track record analysis and take a look at the free visual representations of our analysis for more clarity.
Other High-Performing Stocks: Are there other stocks that provide better prospects with proven track records? Explore our free list of these great stocks here.
To help readers see pass the short term volatility of the financial market, we aim to bring you a long-term focused research analysis purely driven by fundamental data. Note that our analysis does not factor in the latest price sensitive company announcements.
The author is an independent contributor and at the time of publication had no position in the stocks mentioned.
