
 Yahoo Finance
 Is Suncorp Group Limited's (ASX:SUN) 6.6% ROE Better Than Average?
While some investors are already well versed in financial metrics (hat tip), this article is for those who would like to learn about Return On Equity (ROE) and why it is important. We'll use ROE to examine Suncorp Group Limited (ASX:SUN), by way of a worked example.
ROE or return on equity is a useful tool to assess how effectively a company can generate returns on the investment it received from its shareholders. Put another way, it reveals the company's success at turning shareholder investments into profits.
View our latest analysis for Suncorp Group
How To Calculate Return On Equity?
The formula for ROE is:
Return on Equity = Net Profit (from continuing operations) ÷ Shareholders' Equity
So, based on the above formula, the ROE for Suncorp Group is:
6.6% = AU$867m ÷ AU$13b (Based on the trailing twelve months to December 2022).
The 'return' is the yearly profit. That means that for every A$1 worth of shareholders' equity, the company generated A$0.07 in profit.
Does Suncorp Group Have A Good ROE?
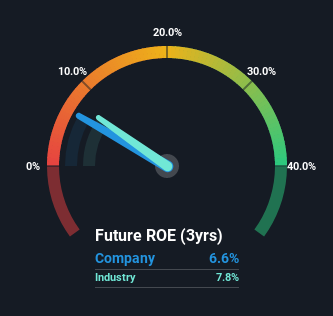
By comparing a company's ROE with its industry average, we can get a quick measure of how good it is. Importantly, this is far from a perfect measure, because companies differ significantly within the same industry classification. If you look at the image below, you can see Suncorp Group has a similar ROE to the average in the Insurance industry classification (7.8%).
That isn't amazing, but it is respectable. Even if the ROE is respectable when compared to the industry, its worth checking if the firm's ROE is being aided by high debt levels. If a company takes on too much debt, it is at higher risk of defaulting on interest payments. You can see the 2 risks we have identified for Suncorp Group by visiting our risks dashboard for free on our platform here.
Why You Should Consider Debt When Looking At ROE
Most companies need money -- from somewhere -- to grow their profits. The cash for investment can come from prior year profits (retained earnings), issuing new shares, or borrowing. In the case of the first and second options, the ROE will reflect this use of cash, for growth. In the latter case, the debt required for growth will boost returns, but will not impact the shareholders' equity. That will make the ROE look better than if no debt was used.
Suncorp Group's Debt And Its 6.6% ROE
It's worth noting the high use of debt by Suncorp Group, leading to its debt to equity ratio of 1.97. With a fairly low ROE, and significant use of debt, it's hard to get excited about this business at the moment. Debt increases risk and reduces options for the company in the future, so you generally want to see some good returns from using it.
Summary
Return on equity is one way we can compare its business quality of different companies. In our books, the highest quality companies have high return on equity, despite low debt. If two companies have the same ROE, then I would generally prefer the one with less debt.
But ROE is just one piece of a bigger puzzle, since high quality businesses often trade on high multiples of earnings. The rate at which profits are likely to grow, relative to the expectations of profit growth reflected in the current price, must be considered, too. So you might want to take a peek at this data-rich interactive graph of forecasts for the company.
Of course Suncorp Group may not be the best stock to buy. So you may wish to see this free collection of other companies that have high ROE and low debt.
Have feedback on this article? Concerned about the content? Get in touch with us directly. Alternatively, email editorial-team (at) simplywallst.com.
This article by Simply Wall St is general in nature. We provide commentary based on historical data and analyst forecasts only using an unbiased methodology and our articles are not intended to be financial advice. It does not constitute a recommendation to buy or sell any stock, and does not take account of your objectives, or your financial situation. We aim to bring you long-term focused analysis driven by fundamental data. Note that our analysis may not factor in the latest price-sensitive company announcements or qualitative material. Simply Wall St has no position in any stocks mentioned.
Join A Paid User Research Session
You’ll receive a US$30 Amazon Gift card for 1 hour of your time while helping us build better investing tools for the individual investors like yourself. Sign up here
