
 Yahoo Finance
 Are Strong Financial Prospects The Force That Is Driving The Momentum In Cadence Design Systems, Inc.'s NASDAQ:CDNS) Stock?
Cadence Design Systems' (NASDAQ:CDNS) stock is up by a considerable 27% over the past three months. Since the market usually pay for a company’s long-term fundamentals, we decided to study the company’s key performance indicators to see if they could be influencing the market. Particularly, we will be paying attention to Cadence Design Systems' ROE today.
Return on equity or ROE is an important factor to be considered by a shareholder because it tells them how effectively their capital is being reinvested. In other words, it is a profitability ratio which measures the rate of return on the capital provided by the company's shareholders.
View our latest analysis for Cadence Design Systems
How Is ROE Calculated?
Return on equity can be calculated by using the formula:
Return on Equity = Net Profit (from continuing operations) ÷ Shareholders' Equity
So, based on the above formula, the ROE for Cadence Design Systems is:
31% = US$849m ÷ US$2.7b (Based on the trailing twelve months to December 2022).
The 'return' is the yearly profit. Another way to think of that is that for every $1 worth of equity, the company was able to earn $0.31 in profit.
What Is The Relationship Between ROE And Earnings Growth?
Thus far, we have learned that ROE measures how efficiently a company is generating its profits. Based on how much of its profits the company chooses to reinvest or "retain", we are then able to evaluate a company's future ability to generate profits. Assuming all else is equal, companies that have both a higher return on equity and higher profit retention are usually the ones that have a higher growth rate when compared to companies that don't have the same features.
Cadence Design Systems' Earnings Growth And 31% ROE
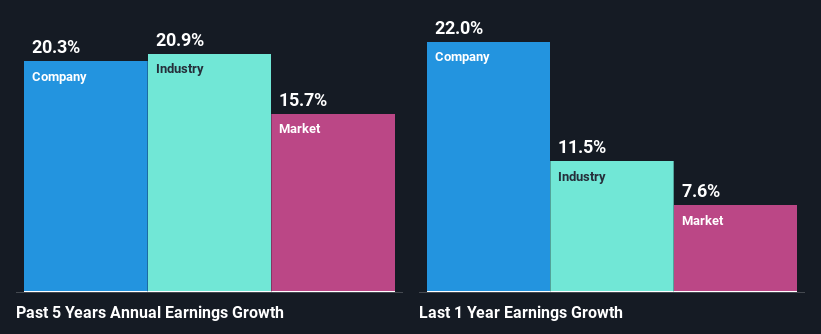
Firstly, we acknowledge that Cadence Design Systems has a significantly high ROE. Secondly, even when compared to the industry average of 11% the company's ROE is quite impressive. Under the circumstances, Cadence Design Systems' considerable five year net income growth of 20% was to be expected.
We then performed a comparison between Cadence Design Systems' net income growth with the industry, which revealed that the company's growth is similar to the average industry growth of 21% in the same period.
Earnings growth is a huge factor in stock valuation. It’s important for an investor to know whether the market has priced in the company's expected earnings growth (or decline). Doing so will help them establish if the stock's future looks promising or ominous. If you're wondering about Cadence Design Systems''s valuation, check out this gauge of its price-to-earnings ratio, as compared to its industry.
Is Cadence Design Systems Efficiently Re-investing Its Profits?
Cadence Design Systems doesn't pay any dividend currently which essentially means that it has been reinvesting all of its profits into the business. This definitely contributes to the high earnings growth number that we discussed above.
Conclusion
In total, we are pretty happy with Cadence Design Systems' performance. Specifically, we like that the company is reinvesting a huge chunk of its profits at a high rate of return. This of course has caused the company to see substantial growth in its earnings. That being so, a study of the latest analyst forecasts show that the company is expected to see a slowdown in its future earnings growth. To know more about the latest analysts predictions for the company, check out this visualization of analyst forecasts for the company.
Have feedback on this article? Concerned about the content? Get in touch with us directly. Alternatively, email editorial-team (at) simplywallst.com.
This article by Simply Wall St is general in nature. We provide commentary based on historical data and analyst forecasts only using an unbiased methodology and our articles are not intended to be financial advice. It does not constitute a recommendation to buy or sell any stock, and does not take account of your objectives, or your financial situation. We aim to bring you long-term focused analysis driven by fundamental data. Note that our analysis may not factor in the latest price-sensitive company announcements or qualitative material. Simply Wall St has no position in any stocks mentioned.
Join A Paid User Research Session
You’ll receive a US$30 Amazon Gift card for 1 hour of your time while helping us build better investing tools for the individual investors like yourself. Sign up here
