
 Yahoo Finance
 Strattec Security (NASDAQ:STRT) Has Some Difficulty Using Its Capital Effectively
If you're looking at a mature business that's past the growth phase, what are some of the underlying trends that pop up? Typically, we'll see the trend of both return on capital employed (ROCE) declining and this usually coincides with a decreasing amount of capital employed. This indicates to us that the business is not only shrinking the size of its net assets, but its returns are falling as well. In light of that, from a first glance at Strattec Security (NASDAQ:STRT), we've spotted some signs that it could be struggling, so let's investigate.
Understanding Return On Capital Employed (ROCE)
Just to clarify if you're unsure, ROCE is a metric for evaluating how much pre-tax income (in percentage terms) a company earns on the capital invested in its business. Analysts use this formula to calculate it for Strattec Security:
Return on Capital Employed = Earnings Before Interest and Tax (EBIT) ÷ (Total Assets - Current Liabilities)
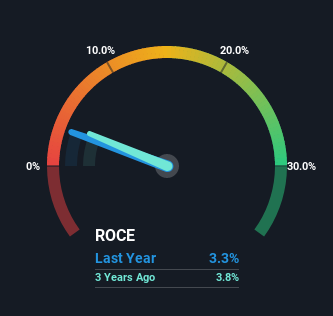
0.033 = US$7.8m ÷ (US$320m - US$82m) (Based on the trailing twelve months to October 2022).
So, Strattec Security has an ROCE of 3.3%. Ultimately, that's a low return and it under-performs the Auto Components industry average of 13%.
See our latest analysis for Strattec Security
Above you can see how the current ROCE for Strattec Security compares to its prior returns on capital, but there's only so much you can tell from the past. If you're interested, you can view the analysts predictions in our free report on analyst forecasts for the company.
The Trend Of ROCE
There is reason to be cautious about Strattec Security, given the returns are trending downwards. To be more specific, the ROCE was 6.3% five years ago, but since then it has dropped noticeably. And on the capital employed front, the business is utilizing roughly the same amount of capital as it was back then. Companies that exhibit these attributes tend to not be shrinking, but they can be mature and facing pressure on their margins from competition. If these trends continue, we wouldn't expect Strattec Security to turn into a multi-bagger.
The Key Takeaway
In summary, it's unfortunate that Strattec Security is generating lower returns from the same amount of capital. Long term shareholders who've owned the stock over the last five years have experienced a 38% depreciation in their investment, so it appears the market might not like these trends either. Unless there is a shift to a more positive trajectory in these metrics, we would look elsewhere.
One more thing, we've spotted 1 warning sign facing Strattec Security that you might find interesting.
For those who like to invest in solid companies, check out this free list of companies with solid balance sheets and high returns on equity.
Have feedback on this article? Concerned about the content? Get in touch with us directly. Alternatively, email editorial-team (at) simplywallst.com.
This article by Simply Wall St is general in nature. We provide commentary based on historical data and analyst forecasts only using an unbiased methodology and our articles are not intended to be financial advice. It does not constitute a recommendation to buy or sell any stock, and does not take account of your objectives, or your financial situation. We aim to bring you long-term focused analysis driven by fundamental data. Note that our analysis may not factor in the latest price-sensitive company announcements or qualitative material. Simply Wall St has no position in any stocks mentioned.
Join A Paid User Research Session
You’ll receive a US$30 Amazon Gift card for 1 hour of your time while helping us build better investing tools for the individual investors like yourself. Sign up here
