
 Yahoo Finance
 Steel Connect (NASDAQ:STCN) Is Looking To Continue Growing Its Returns On Capital
What are the early trends we should look for to identify a stock that could multiply in value over the long term? Firstly, we'll want to see a proven return on capital employed (ROCE) that is increasing, and secondly, an expanding base of capital employed. If you see this, it typically means it's a company with a great business model and plenty of profitable reinvestment opportunities. Speaking of which, we noticed some great changes in Steel Connect's (NASDAQ:STCN) returns on capital, so let's have a look.
Understanding Return On Capital Employed (ROCE)
For those that aren't sure what ROCE is, it measures the amount of pre-tax profits a company can generate from the capital employed in its business. To calculate this metric for Steel Connect, this is the formula:
Return on Capital Employed = Earnings Before Interest and Tax (EBIT) ÷ (Total Assets - Current Liabilities)
0.11 = US$7.7m ÷ (US$156m - US$85m) (Based on the trailing twelve months to January 2023).
Thus, Steel Connect has an ROCE of 11%. That's a relatively normal return on capital, and it's around the 12% generated by the Professional Services industry.
Check out our latest analysis for Steel Connect
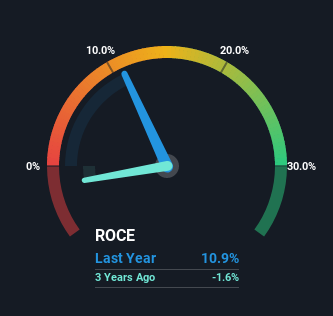
Historical performance is a great place to start when researching a stock so above you can see the gauge for Steel Connect's ROCE against it's prior returns. If you're interested in investigating Steel Connect's past further, check out this free graph of past earnings, revenue and cash flow.
What Can We Tell From Steel Connect's ROCE Trend?
Like most people, we're pleased that Steel Connect is now generating some pretax earnings. The company was generating losses five years ago, but now it's turned around, earning 11% which is no doubt a relief for some early shareholders. Additionally, the business is utilizing 89% less capital than it was five years ago, and taken at face value, that can mean the company needs less funds at work to get a return. This could potentially mean that the company is selling some of its assets.
For the record though, there was a noticeable increase in the company's current liabilities over the period, so we would attribute some of the ROCE growth to that. Essentially the business now has suppliers or short-term creditors funding about 55% of its operations, which isn't ideal. Given it's pretty high ratio, we'd remind investors that having current liabilities at those levels can bring about some risks in certain businesses.
The Bottom Line
From what we've seen above, Steel Connect has managed to increase it's returns on capital all the while reducing it's capital base. Astute investors may have an opportunity here because the stock has declined 62% in the last five years. With that in mind, we believe the promising trends warrant this stock for further investigation.
One more thing: We've identified 2 warning signs with Steel Connect (at least 1 which can't be ignored) , and understanding these would certainly be useful.
If you want to search for solid companies with great earnings, check out this free list of companies with good balance sheets and impressive returns on equity.
Have feedback on this article? Concerned about the content? Get in touch with us directly. Alternatively, email editorial-team (at) simplywallst.com.
This article by Simply Wall St is general in nature. We provide commentary based on historical data and analyst forecasts only using an unbiased methodology and our articles are not intended to be financial advice. It does not constitute a recommendation to buy or sell any stock, and does not take account of your objectives, or your financial situation. We aim to bring you long-term focused analysis driven by fundamental data. Note that our analysis may not factor in the latest price-sensitive company announcements or qualitative material. Simply Wall St has no position in any stocks mentioned.
Join A Paid User Research Session
You’ll receive a US$30 Amazon Gift card for 1 hour of your time while helping us build better investing tools for the individual investors like yourself. Sign up here
