
 Yahoo Finance
 Steamships Trading (ASX:SST) Is Looking To Continue Growing Its Returns On Capital
If we want to find a stock that could multiply over the long term, what are the underlying trends we should look for? Ideally, a business will show two trends; firstly a growing return on capital employed (ROCE) and secondly, an increasing amount of capital employed. If you see this, it typically means it's a company with a great business model and plenty of profitable reinvestment opportunities. With that in mind, we've noticed some promising trends at Steamships Trading (ASX:SST) so let's look a bit deeper.
Understanding Return On Capital Employed (ROCE)
If you haven't worked with ROCE before, it measures the 'return' (pre-tax profit) a company generates from capital employed in its business. The formula for this calculation on Steamships Trading is:
Return on Capital Employed = Earnings Before Interest and Tax (EBIT) ÷ (Total Assets - Current Liabilities)
0.072 = K83m ÷ (K1.6b - K456m) (Based on the trailing twelve months to June 2023).
Therefore, Steamships Trading has an ROCE of 7.2%. On its own that's a low return on capital but it's in line with the industry's average returns of 6.7%.
View our latest analysis for Steamships Trading
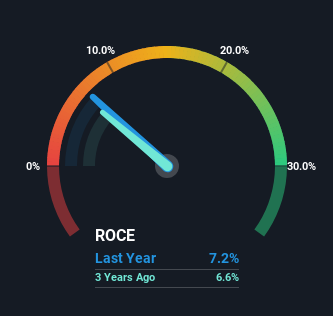
Historical performance is a great place to start when researching a stock so above you can see the gauge for Steamships Trading's ROCE against it's prior returns. If you're interested in investigating Steamships Trading's past further, check out this free graph of past earnings, revenue and cash flow.
What Does the ROCE Trend For Steamships Trading Tell Us?
Steamships Trading's ROCE growth is quite impressive. Looking at the data, we can see that even though capital employed in the business has remained relatively flat, the ROCE generated has risen by 107% over the last five years. So it's likely that the business is now reaping the full benefits of its past investments, since the capital employed hasn't changed considerably. The company is doing well in that sense, and it's worth investigating what the management team has planned for long term growth prospects.
On a side note, we noticed that the improvement in ROCE appears to be partly fueled by an increase in current liabilities. The current liabilities has increased to 28% of total assets, so the business is now more funded by the likes of its suppliers or short-term creditors. Keep an eye out for future increases because when the ratio of current liabilities to total assets gets particularly high, this can introduce some new risks for the business.
In Conclusion...
In summary, we're delighted to see that Steamships Trading has been able to increase efficiencies and earn higher rates of return on the same amount of capital. And since the stock has fallen 20% over the last five years, there might be an opportunity here. That being the case, research into the company's current valuation metrics and future prospects seems fitting.
If you want to know some of the risks facing Steamships Trading we've found 4 warning signs (1 makes us a bit uncomfortable!) that you should be aware of before investing here.
While Steamships Trading may not currently earn the highest returns, we've compiled a list of companies that currently earn more than 25% return on equity. Check out this free list here.
Have feedback on this article? Concerned about the content? Get in touch with us directly. Alternatively, email editorial-team (at) simplywallst.com.
This article by Simply Wall St is general in nature. We provide commentary based on historical data and analyst forecasts only using an unbiased methodology and our articles are not intended to be financial advice. It does not constitute a recommendation to buy or sell any stock, and does not take account of your objectives, or your financial situation. We aim to bring you long-term focused analysis driven by fundamental data. Note that our analysis may not factor in the latest price-sensitive company announcements or qualitative material. Simply Wall St has no position in any stocks mentioned.
