
 Yahoo Finance
 Is The Star Entertainment Group Limited (ASX:SGR) A Financially Strong Company?

Want to participate in a short research study? Help shape the future of investing tools and receive a $20 prize!
Small-caps and large-caps are wildly popular among investors, however, mid-cap stocks, such as The Star Entertainment Group Limited (ASX:SGR), with a market capitalization of AU$4.2b, rarely draw their attention from the investing community. However, generally ignored mid-caps have historically delivered better risk adjusted returns than both of those groups. Let’s take a look at SGR’s debt concentration and assess their financial liquidity to get an idea of their ability to fund strategic acquisitions and grow through cyclical pressures. Remember this is a very top-level look that focuses exclusively on financial health, so I recommend a deeper analysis into SGR here.
View our latest analysis for Star Entertainment Group
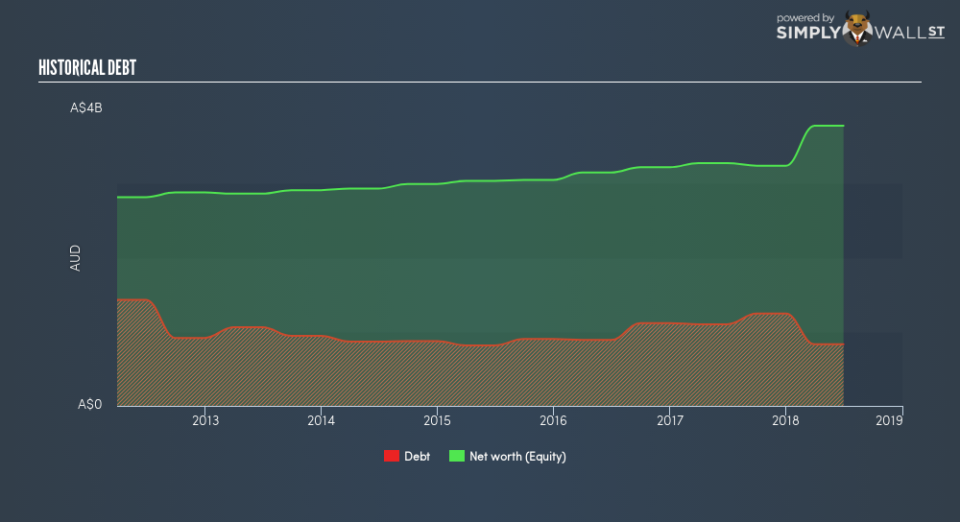
How does SGR’s operating cash flow stack up against its debt?
SGR’s debt levels have fallen from AU$1.1b to AU$831m over the last 12 months , which includes long-term debt. With this debt repayment, SGR’s cash and short-term investments stands at AU$110m , ready to deploy into the business. Moreover, SGR has generated AU$397m in operating cash flow in the last twelve months, leading to an operating cash to total debt ratio of 48%, signalling that SGR’s operating cash is sufficient to cover its debt. This ratio can also be interpreted as a measure of efficiency as an alternative to return on assets. In SGR’s case, it is able to generate 0.48x cash from its debt capital.
Does SGR’s liquid assets cover its short-term commitments?
At the current liabilities level of AU$589m, the company arguably has a rather low level of current assets relative its obligations, with the current ratio last standing at 0.67x.
Does SGR face the risk of succumbing to its debt-load?
With debt at 22% of equity, SGR may be thought of as appropriately levered. This range is considered safe as SGR is not taking on too much debt obligation, which can be restrictive and risky for equity-holders. We can test if SGR’s debt levels are sustainable by measuring interest payments against earnings of a company. Ideally, earnings before interest and tax (EBIT) should cover net interest by at least three times. For SGR, the ratio of 7.55x suggests that interest is appropriately covered, which means that debtors may be willing to loan the company more money, giving SGR ample headroom to grow its debt facilities.
Next Steps:
SGR’s high cash coverage and appropriate debt levels indicate its ability to utilise its borrowings efficiently in order to generate ample cash flow. Though its lack of liquidity raises questions over current asset management practices for the mid-cap. Keep in mind I haven’t considered other factors such as how SGR has been performing in the past. You should continue to research Star Entertainment Group to get a better picture of the stock by looking at:
Future Outlook: What are well-informed industry analysts predicting for SGR’s future growth? Take a look at our free research report of analyst consensus for SGR’s outlook.
Valuation: What is SGR worth today? Is the stock undervalued, even when its growth outlook is factored into its intrinsic value? The intrinsic value infographic in our free research report helps visualize whether SGR is currently mispriced by the market.
Other High-Performing Stocks: Are there other stocks that provide better prospects with proven track records? Explore our free list of these great stocks here.
We aim to bring you long-term focused research analysis driven by fundamental data. Note that our analysis may not factor in the latest price-sensitive company announcements or qualitative material.
If you spot an error that warrants correction, please contact the editor at editorial-team@simplywallst.com. This article by Simply Wall St is general in nature. It does not constitute a recommendation to buy or sell any stock, and does not take account of your objectives, or your financial situation. Simply Wall St has no position in the stocks mentioned. On rare occasion, data errors may occur. Thank you for reading.
