
 Yahoo Finance
 Star Entertainment Group (ASX:SGR) May Have Issues Allocating Its Capital
What underlying fundamental trends can indicate that a company might be in decline? When we see a declining return on capital employed (ROCE) in conjunction with a declining base of capital employed, that's often how a mature business shows signs of aging. This combination can tell you that not only is the company investing less, it's earning less on what it does invest. On that note, looking into Star Entertainment Group (ASX:SGR), we weren't too upbeat about how things were going.
Return On Capital Employed (ROCE): What Is It?
Just to clarify if you're unsure, ROCE is a metric for evaluating how much pre-tax income (in percentage terms) a company earns on the capital invested in its business. To calculate this metric for Star Entertainment Group, this is the formula:
Return on Capital Employed = Earnings Before Interest and Tax (EBIT) ÷ (Total Assets - Current Liabilities)
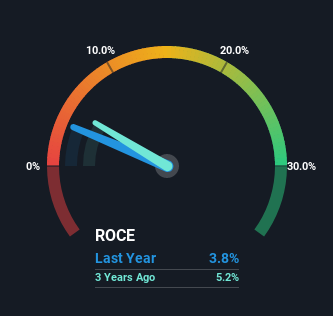
0.038 = AU$134m ÷ (AU$4.3b - AU$736m) (Based on the trailing twelve months to December 2022).
Therefore, Star Entertainment Group has an ROCE of 3.8%. In absolute terms, that's a low return and it also under-performs the Hospitality industry average of 8.7%.
Check out our latest analysis for Star Entertainment Group
Above you can see how the current ROCE for Star Entertainment Group compares to its prior returns on capital, but there's only so much you can tell from the past. If you'd like, you can check out the forecasts from the analysts covering Star Entertainment Group here for free.
How Are Returns Trending?
In terms of Star Entertainment Group's historical ROCE trend, it isn't fantastic. To be more specific, today's ROCE was 6.6% five years ago but has since fallen to 3.8%. What's equally concerning is that the amount of capital deployed in the business has shrunk by 24% over that same period. The combination of lower ROCE and less capital employed can indicate that a business is likely to be facing some competitive headwinds or seeing an erosion to its moat. Typically businesses that exhibit these characteristics aren't the ones that tend to multiply over the long term, because statistically speaking, they've already gone through the growth phase of their life cycle.
The Bottom Line
In summary, it's unfortunate that Star Entertainment Group is shrinking its capital base and also generating lower returns. We expect this has contributed to the stock plummeting 72% during the last five years. That being the case, unless the underlying trends revert to a more positive trajectory, we'd consider looking elsewhere.
If you want to continue researching Star Entertainment Group, you might be interested to know about the 2 warning signs that our analysis has discovered.
For those who like to invest in solid companies, check out this free list of companies with solid balance sheets and high returns on equity.
Have feedback on this article? Concerned about the content? Get in touch with us directly. Alternatively, email editorial-team (at) simplywallst.com.
This article by Simply Wall St is general in nature. We provide commentary based on historical data and analyst forecasts only using an unbiased methodology and our articles are not intended to be financial advice. It does not constitute a recommendation to buy or sell any stock, and does not take account of your objectives, or your financial situation. We aim to bring you long-term focused analysis driven by fundamental data. Note that our analysis may not factor in the latest price-sensitive company announcements or qualitative material. Simply Wall St has no position in any stocks mentioned.
Join A Paid User Research Session
You’ll receive a US$30 Amazon Gift card for 1 hour of your time while helping us build better investing tools for the individual investors like yourself. Sign up here
