
 Yahoo Finance
 Staffline Group (LON:STAF) Has More To Do To Multiply In Value Going Forward
If we want to find a potential multi-bagger, often there are underlying trends that can provide clues. Firstly, we'll want to see a proven return on capital employed (ROCE) that is increasing, and secondly, an expanding base of capital employed. Ultimately, this demonstrates that it's a business that is reinvesting profits at increasing rates of return. Having said that, from a first glance at Staffline Group (LON:STAF) we aren't jumping out of our chairs at how returns are trending, but let's have a deeper look.
Return On Capital Employed (ROCE): What Is It?
For those that aren't sure what ROCE is, it measures the amount of pre-tax profits a company can generate from the capital employed in its business. To calculate this metric for Staffline Group, this is the formula:
Return on Capital Employed = Earnings Before Interest and Tax (EBIT) ÷ (Total Assets - Current Liabilities)
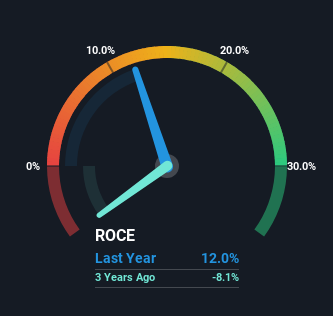
0.12 = UK£7.0m ÷ (UK£212m - UK£154m) (Based on the trailing twelve months to December 2023).
Therefore, Staffline Group has an ROCE of 12%. In absolute terms, that's a pretty standard return but compared to the Professional Services industry average it falls behind.
See our latest analysis for Staffline Group
In the above chart we have measured Staffline Group's prior ROCE against its prior performance, but the future is arguably more important. If you're interested, you can view the analysts predictions in our free analyst report for Staffline Group .
What Does the ROCE Trend For Staffline Group Tell Us?
We're a bit concerned with the trends, because the business is applying 66% less capital than it was five years ago and returns on that capital have stayed flat. When a company effectively decreases its assets base, it's not usually a sign to be optimistic on that company. So if this trend continues, don't be surprised if the business is smaller in a few years time.
On another note, while the change in ROCE trend might not scream for attention, it's interesting that the current liabilities have actually gone up over the last five years. This is intriguing because if current liabilities hadn't increased to 72% of total assets, this reported ROCE would probably be less than12% because total capital employed would be higher.The 12% ROCE could be even lower if current liabilities weren't 72% of total assets, because the the formula would show a larger base of total capital employed. So with current liabilities at such high levels, this effectively means the likes of suppliers or short-term creditors are funding a meaningful part of the business, which in some instances can bring some risks.
What We Can Learn From Staffline Group's ROCE
In summary, Staffline Group isn't reinvesting funds back into the business and returns aren't growing. And investors may be expecting the fundamentals to get a lot worse because the stock has crashed 96% over the last five years. Therefore based on the analysis done in this article, we don't think Staffline Group has the makings of a multi-bagger.
On a separate note, we've found 2 warning signs for Staffline Group you'll probably want to know about.
While Staffline Group may not currently earn the highest returns, we've compiled a list of companies that currently earn more than 25% return on equity. Check out this free list here.
Have feedback on this article? Concerned about the content? Get in touch with us directly. Alternatively, email editorial-team (at) simplywallst.com.
This article by Simply Wall St is general in nature. We provide commentary based on historical data and analyst forecasts only using an unbiased methodology and our articles are not intended to be financial advice. It does not constitute a recommendation to buy or sell any stock, and does not take account of your objectives, or your financial situation. We aim to bring you long-term focused analysis driven by fundamental data. Note that our analysis may not factor in the latest price-sensitive company announcements or qualitative material. Simply Wall St has no position in any stocks mentioned.
