
 Yahoo Finance
 Is SSE plc (LON:SSE) A High Quality Stock To Own?
Many investors are still learning about the various metrics that can be useful when analysing a stock. This article is for those who would like to learn about Return On Equity (ROE). By way of learning-by-doing, we'll look at ROE to gain a better understanding of SSE plc (LON:SSE).
Return on equity or ROE is a key measure used to assess how efficiently a company's management is utilizing the company's capital. In simpler terms, it measures the profitability of a company in relation to shareholder's equity.
Check out our latest analysis for SSE
How Do You Calculate Return On Equity?
The formula for return on equity is:
Return on Equity = Net Profit (from continuing operations) ÷ Shareholders' Equity
So, based on the above formula, the ROE for SSE is:
21% = UK£1.1b ÷ UK£5.2b (Based on the trailing twelve months to September 2020).
The 'return' refers to a company's earnings over the last year. That means that for every £1 worth of shareholders' equity, the company generated £0.21 in profit.
Does SSE Have A Good ROE?
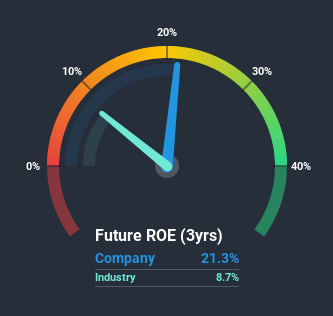
Arguably the easiest way to assess company's ROE is to compare it with the average in its industry. Importantly, this is far from a perfect measure, because companies differ significantly within the same industry classification. As is clear from the image below, SSE has a better ROE than the average (8.7%) in the Electric Utilities industry.
That is a good sign. Bear in mind, a high ROE doesn't always mean superior financial performance. Aside from changes in net income, a high ROE can also be the outcome of high debt relative to equity, which indicates risk. Our risks dashboardshould have the 2 risks we have identified for SSE.
How Does Debt Impact Return On Equity?
Virtually all companies need money to invest in the business, to grow profits. The cash for investment can come from prior year profits (retained earnings), issuing new shares, or borrowing. In the first two cases, the ROE will capture this use of capital to grow. In the latter case, the debt used for growth will improve returns, but won't affect the total equity. Thus the use of debt can improve ROE, albeit along with extra risk in the case of stormy weather, metaphorically speaking.
SSE's Debt And Its 21% ROE
SSE clearly uses a high amount of debt to boost returns, as it has a debt to equity ratio of 1.85. Its ROE is pretty impressive but, it would have probably been lower without the use of debt. Debt does bring extra risk, so it's only really worthwhile when a company generates some decent returns from it.
Summary
Return on equity is a useful indicator of the ability of a business to generate profits and return them to shareholders. A company that can achieve a high return on equity without debt could be considered a high quality business. If two companies have the same ROE, then I would generally prefer the one with less debt.
But when a business is high quality, the market often bids it up to a price that reflects this. It is important to consider other factors, such as future profit growth -- and how much investment is required going forward. So you might want to check this FREE visualization of analyst forecasts for the company.
Of course, you might find a fantastic investment by looking elsewhere. So take a peek at this free list of interesting companies.
This article by Simply Wall St is general in nature. It does not constitute a recommendation to buy or sell any stock, and does not take account of your objectives, or your financial situation. We aim to bring you long-term focused analysis driven by fundamental data. Note that our analysis may not factor in the latest price-sensitive company announcements or qualitative material. Simply Wall St has no position in any stocks mentioned.
Have feedback on this article? Concerned about the content? Get in touch with us directly. Alternatively, email editorial-team (at) simplywallst.com.
