
 Yahoo Finance
 Is Spire Inc.'s (NYSE:SR) Balance Sheet A Threat To Its Future?
Want to participate in a short research study? Help shape the future of investing tools and you could win a $250 gift card!
Spire Inc. (NYSE:SR) is a small-cap stock with a market capitalization of US$4.3b. While investors primarily focus on the growth potential and competitive landscape of the small-cap companies, they end up ignoring a key aspect, which could be the biggest threat to its existence: its financial health. Why is it important? Understanding the company's financial health becomes crucial, since poor capital management may bring about bankruptcies, which occur at a higher rate for small-caps. We'll look at some basic checks that can form a snapshot the company’s financial strength. Nevertheless, this is not a comprehensive overview, so I suggest you dig deeper yourself into SR here.
SR’s Debt (And Cash Flows)
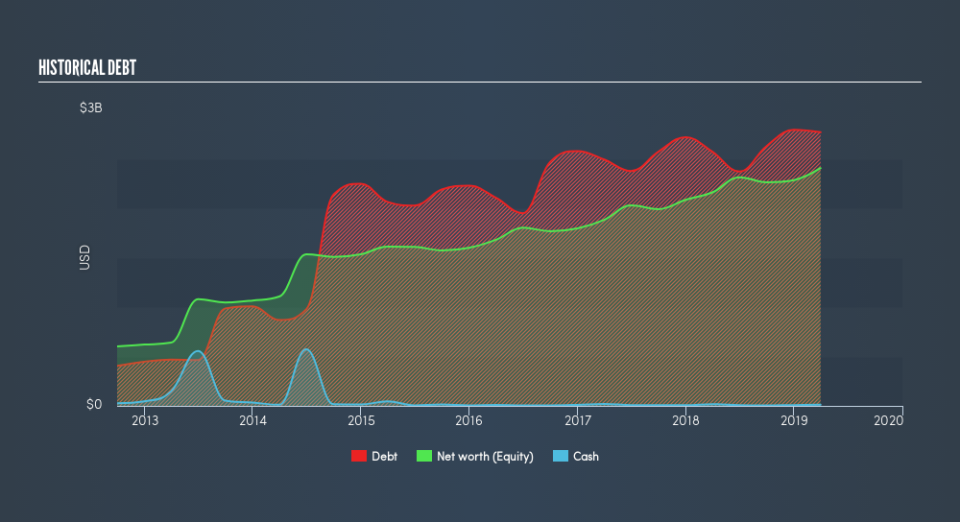
SR's debt levels surged from US$2.6b to US$2.8b over the last 12 months – this includes long-term debt. With this rise in debt, the current cash and short-term investment levels stands at US$11m , ready to be used for running the business. Moreover, SR has produced cash from operations of US$445m over the same time period, resulting in an operating cash to total debt ratio of 16%, signalling that SR’s operating cash is less than its debt.
Does SR’s liquid assets cover its short-term commitments?
At the current liabilities level of US$1.3b, it seems that the business may not be able to easily meet these obligations given the level of current assets of US$794m, with a current ratio of 0.59x. The current ratio is calculated by dividing current assets by current liabilities.
Can SR service its debt comfortably?
With total debt exceeding equity, SR is considered a highly levered company. This is a bit unusual for a small-cap stock, since they generally have a harder time borrowing than large more established companies. We can test if SR’s debt levels are sustainable by measuring interest payments against earnings of a company. Ideally, earnings before interest and tax (EBIT) should cover net interest by at least three times. For SR, the ratio of 3.44x suggests that interest is appropriately covered, which means that lenders may be willing to lend out more funding as SR’s high interest coverage is seen as responsible and safe practice.
Next Steps:
Although SR’s debt level is towards the higher end of the spectrum, its cash flow coverage seems adequate to meet debt obligations which means its debt is being efficiently utilised. Though its low liquidity raises concerns over whether current asset management practices are properly implemented for the small-cap. I admit this is a fairly basic analysis for SR's financial health. Other important fundamentals need to be considered alongside. I recommend you continue to research Spire to get a more holistic view of the stock by looking at:
Future Outlook: What are well-informed industry analysts predicting for SR’s future growth? Take a look at our free research report of analyst consensus for SR’s outlook.
Historical Performance: What has SR's returns been like over the past? Go into more detail in the past track record analysis and take a look at the free visual representations of our analysis for more clarity.
Other High-Performing Stocks: Are there other stocks that provide better prospects with proven track records? Explore our free list of these great stocks here.
We aim to bring you long-term focused research analysis driven by fundamental data. Note that our analysis may not factor in the latest price-sensitive company announcements or qualitative material.
If you spot an error that warrants correction, please contact the editor at editorial-team@simplywallst.com. This article by Simply Wall St is general in nature. It does not constitute a recommendation to buy or sell any stock, and does not take account of your objectives, or your financial situation. Simply Wall St has no position in the stocks mentioned. Thank you for reading.
