
 Yahoo Finance
 Is Speedcast International Limited (ASX:SDA) A Volatile Stock?

If you own shares in Speedcast International Limited (ASX:SDA) then it's worth thinking about how it contributes to the volatility of your portfolio, overall. In finance, Beta is a measure of volatility. Modern finance theory considers volatility to be a measure of risk, and there are two main types of price volatility. The first category is company specific volatility. This can be dealt with by limiting your exposure to any particular stock. The second type is the broader market volatility, which you cannot diversify away, since it arises from macroeconomic factors which directly affects all the stocks on the market.
Some stocks mimic the volatility of the market quite closely, while others demonstrate muted, exagerrated or uncorrelated price movements. Beta is a widely used metric to measure a stock's exposure to market risk (volatility). Before we go on, it's worth noting that Warren Buffett pointed out in his 2014 letter to shareholders that 'volatility is far from synonymous with risk.' Having said that, beta can still be rather useful. The first thing to understand about beta is that the beta of the overall market is one. Any stock with a beta of greater than one is considered more volatile than the market, while those with a beta below one are either less volatile or poorly correlated with the market.
Check out our latest analysis for Speedcast International
What we can learn from SDA's beta value
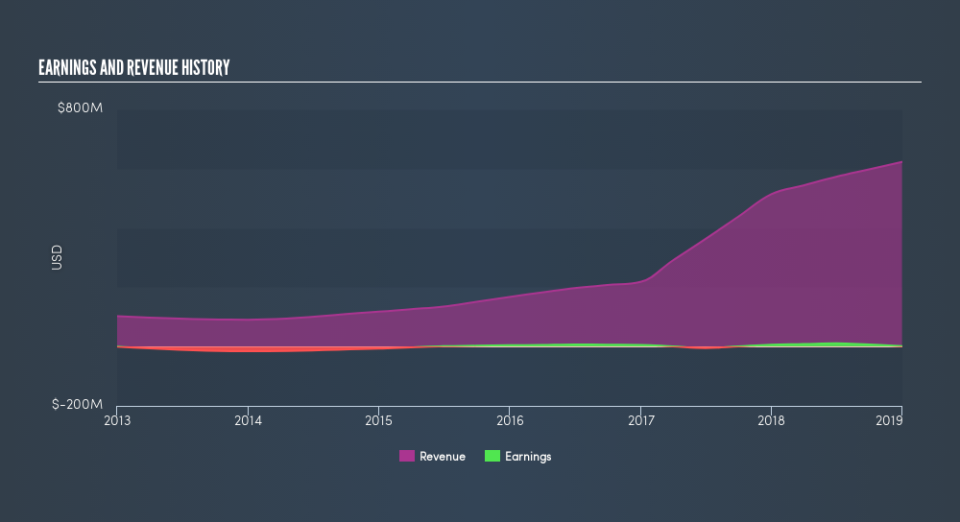
Looking at the last five years, Speedcast International has a beta of 0.81. The fact that this is well below 1 indicates that its share price movements haven't historically been very sensitive to overall market volatility. This means that -- if history is a guide -- buying the stock would reduce the impact of overall market volatility in many portfolios (depending on the beta of the portfolio, of course). Many would argue that beta is useful in position sizing, but fundamental metrics such as revenue and earnings are more important overall. You can see Speedcast International's revenue and earnings in the image below.
Could SDA's size cause it to be more volatile?
Speedcast International is a noticeably small company, with a market capitalisation of AU$411m. Most companies this size are not always actively traded. It is not unusual for very small companies to have a low beta value, especially if only low volumes of shares are traded. Even when they are traded more actively, the share price is often more susceptible to company specific developments than overall market volatility.
What this means for you:
One potential advantage of owning low beta stocks like Speedcast International is that your overall portfolio won't be too sensitive to overall market movements. However, this can be a blessing or a curse, depending on what's happening in the broader market. This article aims to educate investors about beta values, but it's well worth looking at important company-specific fundamentals such as Speedcast International’s financial health and performance track record. I urge you to continue your research by taking a look at the following:
Future Outlook: What are well-informed industry analysts predicting for SDA’s future growth? Take a look at our free research report of analyst consensus for SDA’s outlook.
Past Track Record: Has SDA been consistently performing well irrespective of the ups and downs in the market? Go into more detail in the past performance analysis and take a look at the free visual representations of SDA's historicals for more clarity.
Other Interesting Stocks: It's worth checking to see how SDA measures up against other companies on valuation. You could start with this free list of prospective options.
We aim to bring you long-term focused research analysis driven by fundamental data. Note that our analysis may not factor in the latest price-sensitive company announcements or qualitative material.
If you spot an error that warrants correction, please contact the editor at editorial-team@simplywallst.com. This article by Simply Wall St is general in nature. It does not constitute a recommendation to buy or sell any stock, and does not take account of your objectives, or your financial situation. Simply Wall St has no position in the stocks mentioned. Thank you for reading.
