
 Yahoo Finance
 Spark Infrastructure Group (ASX:SKI) Has More To Do To Multiply In Value Going Forward
What trends should we look for it we want to identify stocks that can multiply in value over the long term? Typically, we'll want to notice a trend of growing return on capital employed (ROCE) and alongside that, an expanding base of capital employed. Ultimately, this demonstrates that it's a business that is reinvesting profits at increasing rates of return. However, after investigating Spark Infrastructure Group (ASX:SKI), we don't think it's current trends fit the mold of a multi-bagger.
What is Return On Capital Employed (ROCE)?
Just to clarify if you're unsure, ROCE is a metric for evaluating how much pre-tax income (in percentage terms) a company earns on the capital invested in its business. Analysts use this formula to calculate it for Spark Infrastructure Group:
Return on Capital Employed = Earnings Before Interest and Tax (EBIT) ÷ (Total Assets - Current Liabilities)
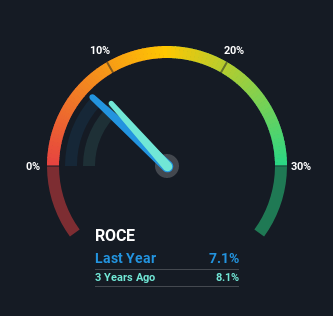
0.071 = AU$226m ÷ (AU$3.2b - AU$72m) (Based on the trailing twelve months to June 2021).
Therefore, Spark Infrastructure Group has an ROCE of 7.1%. On its own, that's a low figure but it's around the 6.1% average generated by the Electric Utilities industry.
Check out our latest analysis for Spark Infrastructure Group
Above you can see how the current ROCE for Spark Infrastructure Group compares to its prior returns on capital, but there's only so much you can tell from the past. If you'd like, you can check out the forecasts from the analysts covering Spark Infrastructure Group here for free.
So How Is Spark Infrastructure Group's ROCE Trending?
There hasn't been much to report for Spark Infrastructure Group's returns and its level of capital employed because both metrics have been steady for the past five years. This tells us the company isn't reinvesting in itself, so it's plausible that it's past the growth phase. With that in mind, unless investment picks up again in the future, we wouldn't expect Spark Infrastructure Group to be a multi-bagger going forward. That probably explains why Spark Infrastructure Group has been paying out 551% of its earnings as dividends to shareholders. These mature businesses typically have reliable earnings and not many places to reinvest them, so the next best option is to put the earnings into shareholders pockets.
The Key Takeaway
In a nutshell, Spark Infrastructure Group has been trudging along with the same returns from the same amount of capital over the last five years. Although the market must be expecting these trends to improve because the stock has gained 93% over the last five years. But if the trajectory of these underlying trends continue, we think the likelihood of it being a multi-bagger from here isn't high.
Like most companies, Spark Infrastructure Group does come with some risks, and we've found 3 warning signs that you should be aware of.
While Spark Infrastructure Group isn't earning the highest return, check out this free list of companies that are earning high returns on equity with solid balance sheets.
This article by Simply Wall St is general in nature. We provide commentary based on historical data and analyst forecasts only using an unbiased methodology and our articles are not intended to be financial advice. It does not constitute a recommendation to buy or sell any stock, and does not take account of your objectives, or your financial situation. We aim to bring you long-term focused analysis driven by fundamental data. Note that our analysis may not factor in the latest price-sensitive company announcements or qualitative material. Simply Wall St has no position in any stocks mentioned.
Have feedback on this article? Concerned about the content? Get in touch with us directly. Alternatively, email editorial-team (at) simplywallst.com.
