
 Yahoo Finance
 Spark I Acquisition Corporation (NASDAQ:SPKL) stock most popular amongst individual investors who own 55%, while private equity firms hold 39%
Key Insights
Spark I Acquisition's significant individual investors ownership suggests that the key decisions are influenced by shareholders from the larger public
The top 11 shareholders own 45% of the company
Ownership research, combined with past performance data can help provide a good understanding of opportunities in a stock
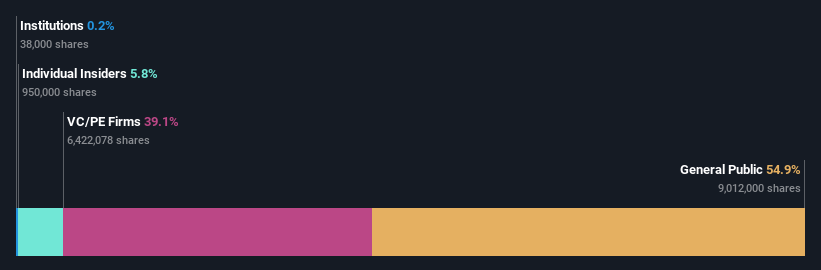
Every investor in Spark I Acquisition Corporation (NASDAQ:SPKL) should be aware of the most powerful shareholder groups. The group holding the most number of shares in the company, around 55% to be precise, is individual investors. In other words, the group stands to gain the most (or lose the most) from their investment into the company.
Meanwhile, private equity firms make up 39% of the company’s shareholders.
Let's take a closer look to see what the different types of shareholders can tell us about Spark I Acquisition.
View our latest analysis for Spark I Acquisition
What Does The Lack Of Institutional Ownership Tell Us About Spark I Acquisition?
We don't tend to see institutional investors holding stock of companies that are very risky, thinly traded, or very small. Though we do sometimes see large companies without institutions on the register, it's not particularly common.
There are many reasons why a company might not have any institutions on the share registry. It may be hard for institutions to buy large amounts of shares, if liquidity (the amount of shares traded each day) is low. If the company has not needed to raise capital, institutions might lack the opportunity to build a position. Alternatively, there might be something about the company that has kept institutional investors away. Spark I Acquisition might not have the sort of past performance institutions are looking for, or perhaps they simply have not studied the business closely.
Spark I Acquisition is not owned by hedge funds. Looking at our data, we can see that the largest shareholder is SparkLabs Group with 39% of shares outstanding. With 1.5% and 0.6% of the shares outstanding respectively, James Rhee and Ling Tong are the second and third largest shareholders. James Rhee, who is the second-largest shareholder, also happens to hold the title of Chief Executive Officer.
On studying our ownership data, we found that 11 of the top shareholders collectively own less than 50% of the share register, implying that no single individual has a majority interest.
While studying institutional ownership for a company can add value to your research, it is also a good practice to research analyst recommendations to get a deeper understand of a stock's expected performance. We're not picking up on any analyst coverage of the stock at the moment, so the company is unlikely to be widely held.
Insider Ownership Of Spark I Acquisition
The definition of company insiders can be subjective and does vary between jurisdictions. Our data reflects individual insiders, capturing board members at the very least. Management ultimately answers to the board. However, it is not uncommon for managers to be executive board members, especially if they are a founder or the CEO.
Most consider insider ownership a positive because it can indicate the board is well aligned with other shareholders. However, on some occasions too much power is concentrated within this group.
We can see that insiders own shares in Spark I Acquisition Corporation. It has a market capitalization of just US$166m, and insiders have US$9.6m worth of shares, in their own names. Some would say this shows alignment of interests between shareholders and the board, though we generally prefer to see bigger insider holdings. But it might be worth checking if those insiders have been selling.
General Public Ownership
The general public -- including retail investors -- own 55% of Spark I Acquisition. With this amount of ownership, retail investors can collectively play a role in decisions that affect shareholder returns, such as dividend policies and the appointment of directors. They can also exercise the power to vote on acquisitions or mergers that may not improve profitability.
Private Equity Ownership
With an ownership of 39%, private equity firms are in a position to play a role in shaping corporate strategy with a focus on value creation. Some investors might be encouraged by this, since private equity are sometimes able to encourage strategies that help the market see the value in the company. Alternatively, those holders might be exiting the investment after taking it public.
Next Steps:
It's always worth thinking about the different groups who own shares in a company. But to understand Spark I Acquisition better, we need to consider many other factors. Like risks, for instance. Every company has them, and we've spotted 5 warning signs for Spark I Acquisition (of which 4 shouldn't be ignored!) you should know about.
Of course, you might find a fantastic investment by looking elsewhere. So take a peek at this free list of interesting companies.
NB: Figures in this article are calculated using data from the last twelve months, which refer to the 12-month period ending on the last date of the month the financial statement is dated. This may not be consistent with full year annual report figures.
Have feedback on this article? Concerned about the content? Get in touch with us directly. Alternatively, email editorial-team (at) simplywallst.com.
This article by Simply Wall St is general in nature. We provide commentary based on historical data and analyst forecasts only using an unbiased methodology and our articles are not intended to be financial advice. It does not constitute a recommendation to buy or sell any stock, and does not take account of your objectives, or your financial situation. We aim to bring you long-term focused analysis driven by fundamental data. Note that our analysis may not factor in the latest price-sensitive company announcements or qualitative material. Simply Wall St has no position in any stocks mentioned.
