
 Yahoo Finance
 Southern Score Builders Berhad (KLSE:SSB8) Looks To Prolong Its Impressive Returns
What are the early trends we should look for to identify a stock that could multiply in value over the long term? Firstly, we'll want to see a proven return on capital employed (ROCE) that is increasing, and secondly, an expanding base of capital employed. Ultimately, this demonstrates that it's a business that is reinvesting profits at increasing rates of return. So, when we ran our eye over Southern Score Builders Berhad's (KLSE:SSB8) trend of ROCE, we really liked what we saw.
Understanding Return On Capital Employed (ROCE)
For those who don't know, ROCE is a measure of a company's yearly pre-tax profit (its return), relative to the capital employed in the business. The formula for this calculation on Southern Score Builders Berhad is:
Return on Capital Employed = Earnings Before Interest and Tax (EBIT) ÷ (Total Assets - Current Liabilities)
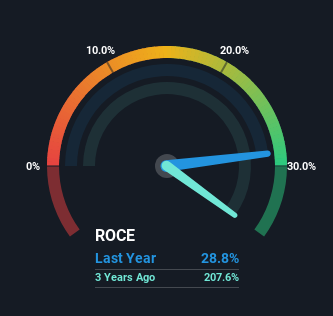
0.29 = RM46m ÷ (RM218m - RM58m) (Based on the trailing twelve months to December 2023).
Therefore, Southern Score Builders Berhad has an ROCE of 29%. That's a fantastic return and not only that, it outpaces the average of 7.7% earned by companies in a similar industry.
View our latest analysis for Southern Score Builders Berhad
While the past is not representative of the future, it can be helpful to know how a company has performed historically, which is why we have this chart above. If you want to delve into the historical earnings , check out these free graphs detailing revenue and cash flow performance of Southern Score Builders Berhad.
How Are Returns Trending?
We'd be pretty happy with returns on capital like Southern Score Builders Berhad. The company has consistently earned 29% for the last five years, and the capital employed within the business has risen 218% in that time. Returns like this are the envy of most businesses and given it has repeatedly reinvested at these rates, that's even better. If Southern Score Builders Berhad can keep this up, we'd be very optimistic about its future.
One more thing to note, even though ROCE has remained relatively flat over the last five years, the reduction in current liabilities to 26% of total assets, is good to see from a business owner's perspective. Effectively suppliers now fund less of the business, which can lower some elements of risk.
The Bottom Line On Southern Score Builders Berhad's ROCE
Southern Score Builders Berhad has demonstrated its proficiency by generating high returns on increasing amounts of capital employed, which we're thrilled about. And long term investors would be thrilled with the 115% return they've received over the last year. So while investors seem to be recognizing these promising trends, we still believe the stock deserves further research.
One final note, you should learn about the 3 warning signs we've spotted with Southern Score Builders Berhad (including 2 which make us uncomfortable) .
Southern Score Builders Berhad is not the only stock earning high returns. If you'd like to see more, check out our free list of companies earning high returns on equity with solid fundamentals.
Have feedback on this article? Concerned about the content? Get in touch with us directly. Alternatively, email editorial-team (at) simplywallst.com.
This article by Simply Wall St is general in nature. We provide commentary based on historical data and analyst forecasts only using an unbiased methodology and our articles are not intended to be financial advice. It does not constitute a recommendation to buy or sell any stock, and does not take account of your objectives, or your financial situation. We aim to bring you long-term focused analysis driven by fundamental data. Note that our analysis may not factor in the latest price-sensitive company announcements or qualitative material. Simply Wall St has no position in any stocks mentioned.
