
 Yahoo Finance
 Southern Cross Media Group's (ASX:SXL) Returns On Capital Tell Us There Is Reason To Feel Uneasy
What underlying fundamental trends can indicate that a company might be in decline? A business that's potentially in decline often shows two trends, a return on capital employed (ROCE) that's declining, and a base of capital employed that's also declining. This reveals that the company isn't compounding shareholder wealth because returns are falling and its net asset base is shrinking. And from a first read, things don't look too good at Southern Cross Media Group (ASX:SXL), so let's see why.
Return On Capital Employed (ROCE): What is it?
For those that aren't sure what ROCE is, it measures the amount of pre-tax profits a company can generate from the capital employed in its business. The formula for this calculation on Southern Cross Media Group is:
Return on Capital Employed = Earnings Before Interest and Tax (EBIT) ÷ (Total Assets - Current Liabilities)
0.058 = AU$81m ÷ (AU$1.5b - AU$120m) (Based on the trailing twelve months to December 2020).
Thus, Southern Cross Media Group has an ROCE of 5.8%. On its own that's a low return on capital but it's in line with the industry's average returns of 5.8%.
See our latest analysis for Southern Cross Media Group
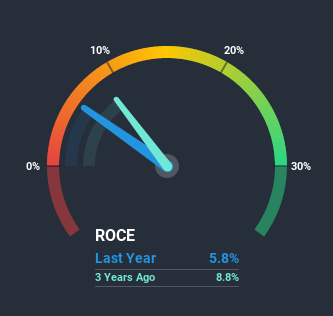
Above you can see how the current ROCE for Southern Cross Media Group compares to its prior returns on capital, but there's only so much you can tell from the past. If you're interested, you can view the analysts predictions in our free report on analyst forecasts for the company.
What Can We Tell From Southern Cross Media Group's ROCE Trend?
In terms of Southern Cross Media Group's historical ROCE movements, the trend doesn't inspire confidence. Unfortunately the returns on capital have diminished from the 9.2% that they were earning five years ago. Meanwhile, capital employed in the business has stayed roughly the flat over the period. Companies that exhibit these attributes tend to not be shrinking, but they can be mature and facing pressure on their margins from competition. So because these trends aren't typically conducive to creating a multi-bagger, we wouldn't hold our breath on Southern Cross Media Group becoming one if things continue as they have.
What We Can Learn From Southern Cross Media Group's ROCE
In the end, the trend of lower returns on the same amount of capital isn't typically an indication that we're looking at a growth stock. Investors haven't taken kindly to these developments, since the stock has declined 67% from where it was five years ago. That being the case, unless the underlying trends revert to a more positive trajectory, we'd consider looking elsewhere.
Since virtually every company faces some risks, it's worth knowing what they are, and we've spotted 3 warning signs for Southern Cross Media Group (of which 1 is potentially serious!) that you should know about.
For those who like to invest in solid companies, check out this free list of companies with solid balance sheets and high returns on equity.
This article by Simply Wall St is general in nature. It does not constitute a recommendation to buy or sell any stock, and does not take account of your objectives, or your financial situation. We aim to bring you long-term focused analysis driven by fundamental data. Note that our analysis may not factor in the latest price-sensitive company announcements or qualitative material. Simply Wall St has no position in any stocks mentioned.
Have feedback on this article? Concerned about the content? Get in touch with us directly. Alternatively, email editorial-team (at) simplywallst.com.
