
 Yahoo Finance
 Here’s What Sonic Healthcare Limited’s (ASX:SHL) P/E Is Telling Us

This article is written for those who want to get better at using price to earnings ratios (P/E ratios). To keep it practical, we’ll show how Sonic Healthcare Limited’s (ASX:SHL) P/E ratio could help you assess the value on offer. Based on the last twelve months, Sonic Healthcare’s P/E ratio is 20.09. That corresponds to an earnings yield of approximately 5.0%.
Check out our latest analysis for Sonic Healthcare
How Do I Calculate A Price To Earnings Ratio?
The formula for P/E is:
Price to Earnings Ratio = Price per Share ÷ Earnings per Share (EPS)
Or for Sonic Healthcare:
P/E of 20.09 = A$22.63 ÷ A$1.13 (Based on the trailing twelve months to June 2018.)
Is A High Price-to-Earnings Ratio Good?
A higher P/E ratio means that investors are paying a higher price for each A$1 of company earnings. That isn’t a good or a bad thing on its own, but a high P/E means that buyers have a higher opinion of the business’s prospects, relative to stocks with a lower P/E.
How Growth Rates Impact P/E Ratios
P/E ratios primarily reflect market expectations around earnings growth rates. Earnings growth means that in the future the ‘E’ will be higher. That means unless the share price increases, the P/E will reduce in a few years. So while a stock may look expensive based on past earnings, it could be cheap based on future earnings.
Sonic Healthcare’s earnings per share grew by -9.7% in the last twelve months. And earnings per share have improved by 5.2% annually, over the last five years.
How Does Sonic Healthcare’s P/E Ratio Compare To Its Peers?
We can get an indication of market expectations by looking at the P/E ratio. You can see in the image below that the average P/E (17.1) for companies in the healthcare industry is lower than Sonic Healthcare’s P/E.
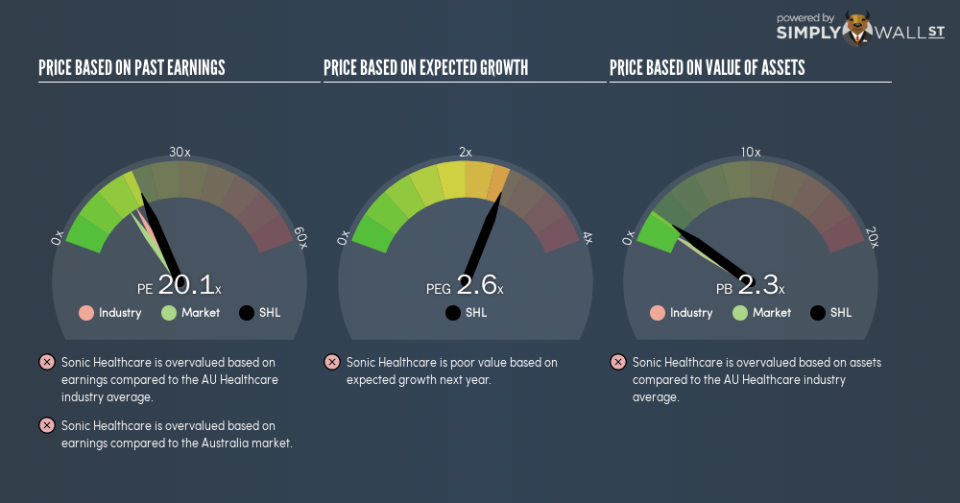
Its relatively high P/E ratio indicates that Sonic Healthcare shareholders think it will perform better than other companies in its industry classification. Clearly the market expects growth, but it isn’t guaranteed. So further research is always essential. I often monitor director buying and selling.
A Limitation: P/E Ratios Ignore Debt and Cash In The Bank
Don’t forget that the P/E ratio considers market capitalization. That means it doesn’t take debt or cash into account. Hypothetically, a company could reduce its future P/E ratio by spending its cash (or taking on debt) to achieve higher earnings.
Such expenditure might be good or bad, in the long term, but the point here is that the balance sheet is not reflected by this ratio.
Is Debt Impacting Sonic Healthcare’s P/E?
Sonic Healthcare’s net debt is 26% of its market cap. If you want to compare its P/E ratio to other companies, you should absolutely keep in mind it has significant borrowings.
The Verdict On Sonic Healthcare’s P/E Ratio
Sonic Healthcare has a P/E of 20.1. That’s higher than the average in the AU market, which is 15. Given the debt is only modest, and earnings are already moving in the right direction, it’s not surprising that the market expects continued improvement.
Investors should be looking to buy stocks that the market is wrong about. If the reality for a company is better than it expects, you can make money by buying and holding for the long term. So this free visual report on analyst forecasts could hold they key to an excellent investment decision.
Of course you might be able to find a better stock than Sonic Healthcare. So you may wish to see this free collection of other companies that have grown earnings strongly.
To help readers see past the short term volatility of the financial market, we aim to bring you a long-term focused research analysis purely driven by fundamental data. Note that our analysis does not factor in the latest price-sensitive company announcements.
The author is an independent contributor and at the time of publication had no position in the stocks mentioned. For errors that warrant correction please contact the editor at editorial-team@simplywallst.com.
