
 Yahoo Finance
 Smiths Group's (LON:SMIN) Stock Price Has Reduced18% In The Past Year

Smiths Group plc (LON:SMIN) shareholders should be happy to see the share price up 14% in the last quarter. But that is minimal compensation for the share price under-performance over the last year. In fact, the price has declined 18% in a year, falling short of the returns you could get by investing in an index fund.
See our latest analysis for Smiths Group
To paraphrase Benjamin Graham: Over the short term the market is a voting machine, but over the long term it's a weighing machine. One way to examine how market sentiment has changed over time is to look at the interaction between a company's share price and its earnings per share (EPS).
Even though the Smiths Group share price is down over the year, its EPS actually improved. Of course, the situation might betray previous over-optimism about growth.
The divergence between the EPS and the share price is quite notable, during the year. So it's well worth checking out some other metrics, too.
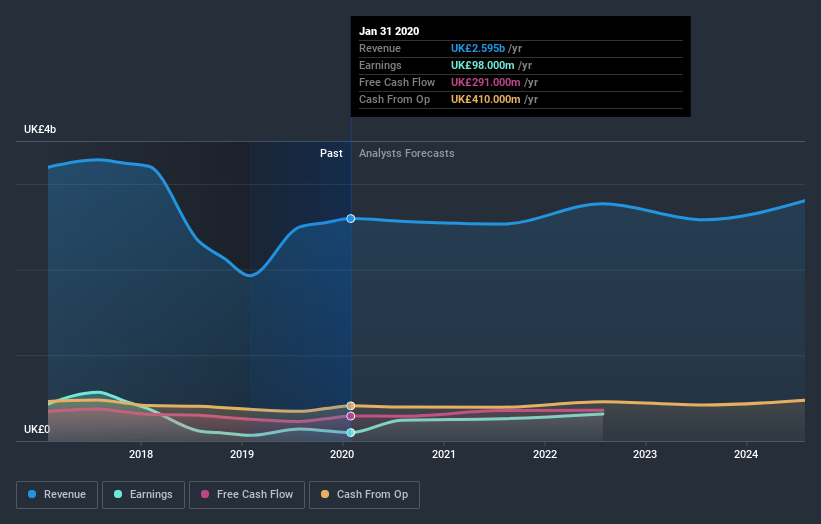
Smiths Group's revenue is actually up 35% over the last year. Since the fundamental metrics don't readily explain the share price drop, there might be an opportunity if the market has overreacted.
You can see how earnings and revenue have changed over time in the image below (click on the chart to see the exact values).
We know that Smiths Group has improved its bottom line lately, but what does the future have in store? So it makes a lot of sense to check out what analysts think Smiths Group will earn in the future (free profit forecasts).
What about the Total Shareholder Return (TSR)?
We've already covered Smiths Group's share price action, but we should also mention its total shareholder return (TSR). Arguably the TSR is a more complete return calculation because it accounts for the value of dividends (as if they were reinvested), along with the hypothetical value of any discounted capital that have been offered to shareholders. Smiths Group's TSR of was a loss of 16% for the year. That wasn't as bad as its share price return, because it has paid dividends.
A Different Perspective
We regret to report that Smiths Group shareholders are down 16% for the year. Unfortunately, that's worse than the broader market decline of 14%. However, it could simply be that the share price has been impacted by broader market jitters. It might be worth keeping an eye on the fundamentals, in case there's a good opportunity. Longer term investors wouldn't be so upset, since they would have made 5.8%, each year, over five years. If the fundamental data continues to indicate long term sustainable growth, the current sell-off could be an opportunity worth considering. While it is well worth considering the different impacts that market conditions can have on the share price, there are other factors that are even more important. For example, we've discovered 1 warning sign for Smiths Group that you should be aware of before investing here.
If you are like me, then you will not want to miss this free list of growing companies that insiders are buying.
Please note, the market returns quoted in this article reflect the market weighted average returns of stocks that currently trade on GB exchanges.
This article by Simply Wall St is general in nature. It does not constitute a recommendation to buy or sell any stock, and does not take account of your objectives, or your financial situation. We aim to bring you long-term focused analysis driven by fundamental data. Note that our analysis may not factor in the latest price-sensitive company announcements or qualitative material. Simply Wall St has no position in any stocks mentioned.
Have feedback on this article? Concerned about the content? Get in touch with us directly. Alternatively, email editorial-team@simplywallst.com.
