
 Yahoo Finance
 Slowing Rates Of Return At Channel Infrastructure NZ (NZSE:CHI) Leave Little Room For Excitement
What trends should we look for it we want to identify stocks that can multiply in value over the long term? One common approach is to try and find a company with returns on capital employed (ROCE) that are increasing, in conjunction with a growing amount of capital employed. This shows us that it's a compounding machine, able to continually reinvest its earnings back into the business and generate higher returns. Having said that, from a first glance at Channel Infrastructure NZ (NZSE:CHI) we aren't jumping out of our chairs at how returns are trending, but let's have a deeper look.
Understanding Return On Capital Employed (ROCE)
Just to clarify if you're unsure, ROCE is a metric for evaluating how much pre-tax income (in percentage terms) a company earns on the capital invested in its business. Analysts use this formula to calculate it for Channel Infrastructure NZ:
Return on Capital Employed = Earnings Before Interest and Tax (EBIT) ÷ (Total Assets - Current Liabilities)
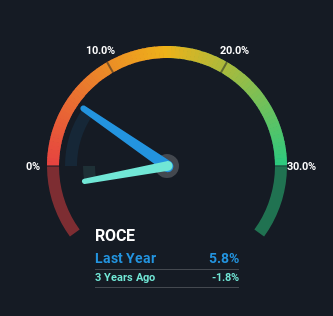
0.058 = NZ$49m ÷ (NZ$957m - NZ$110m) (Based on the trailing twelve months to June 2023).
Therefore, Channel Infrastructure NZ has an ROCE of 5.8%. Ultimately, that's a low return and it under-performs the Oil and Gas industry average of 11%.
View our latest analysis for Channel Infrastructure NZ
In the above chart we have measured Channel Infrastructure NZ's prior ROCE against its prior performance, but the future is arguably more important. If you'd like to see what analysts are forecasting going forward, you should check out our free report for Channel Infrastructure NZ.
So How Is Channel Infrastructure NZ's ROCE Trending?
We're a bit concerned with the trends, because the business is applying 26% less capital than it was five years ago and returns on that capital have stayed flat. When a company effectively decreases its assets base, it's not usually a sign to be optimistic on that company. In addition to that, since the ROCE doesn't scream "quality" at 5.8%, it's hard to get excited about these developments.
In Conclusion...
Overall, we're not ecstatic to see Channel Infrastructure NZ reducing the amount of capital it employs in the business. Since the stock has declined 28% over the last five years, investors may not be too optimistic on this trend improving either. On the whole, we aren't too inspired by the underlying trends and we think there may be better chances of finding a multi-bagger elsewhere.
On a separate note, we've found 2 warning signs for Channel Infrastructure NZ you'll probably want to know about.
While Channel Infrastructure NZ isn't earning the highest return, check out this free list of companies that are earning high returns on equity with solid balance sheets.
Have feedback on this article? Concerned about the content? Get in touch with us directly. Alternatively, email editorial-team (at) simplywallst.com.
This article by Simply Wall St is general in nature. We provide commentary based on historical data and analyst forecasts only using an unbiased methodology and our articles are not intended to be financial advice. It does not constitute a recommendation to buy or sell any stock, and does not take account of your objectives, or your financial situation. We aim to bring you long-term focused analysis driven by fundamental data. Note that our analysis may not factor in the latest price-sensitive company announcements or qualitative material. Simply Wall St has no position in any stocks mentioned.
