
 Yahoo Finance
 Slowing Rates Of Return At Baker Hughes (NASDAQ:BKR) Leave Little Room For Excitement
Did you know there are some financial metrics that can provide clues of a potential multi-bagger? Firstly, we'll want to see a proven return on capital employed (ROCE) that is increasing, and secondly, an expanding base of capital employed. This shows us that it's a compounding machine, able to continually reinvest its earnings back into the business and generate higher returns. Having said that, from a first glance at Baker Hughes (NASDAQ:BKR) we aren't jumping out of our chairs at how returns are trending, but let's have a deeper look.
Return On Capital Employed (ROCE): What is it?
For those who don't know, ROCE is a measure of a company's yearly pre-tax profit (its return), relative to the capital employed in the business. To calculate this metric for Baker Hughes, this is the formula:
Return on Capital Employed = Earnings Before Interest and Tax (EBIT) ÷ (Total Assets - Current Liabilities)
0.065 = US$1.7b ÷ (US$35b - US$9.1b) (Based on the trailing twelve months to March 2022).
So, Baker Hughes has an ROCE of 6.5%. In absolute terms, that's a low return, but it's much better than the Energy Services industry average of 5.0%.
See our latest analysis for Baker Hughes
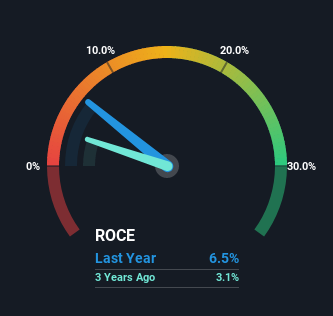
Above you can see how the current ROCE for Baker Hughes compares to its prior returns on capital, but there's only so much you can tell from the past. If you'd like, you can check out the forecasts from the analysts covering Baker Hughes here for free.
What Does the ROCE Trend For Baker Hughes Tell Us?
The returns on capital haven't changed much for Baker Hughes in recent years. The company has consistently earned 6.5% for the last five years, and the capital employed within the business has risen 52% in that time. Given the company has increased the amount of capital employed, it appears the investments that have been made simply don't provide a high return on capital.
In Conclusion...
In conclusion, Baker Hughes has been investing more capital into the business, but returns on that capital haven't increased. Unsurprisingly then, the total return to shareholders over the last five years has been flat. In any case, the stock doesn't have these traits of a multi-bagger discussed above, so if that's what you're looking for, we think you'd have more luck elsewhere.
One more thing, we've spotted 3 warning signs facing Baker Hughes that you might find interesting.
If you want to search for solid companies with great earnings, check out this free list of companies with good balance sheets and impressive returns on equity.
Have feedback on this article? Concerned about the content? Get in touch with us directly. Alternatively, email editorial-team (at) simplywallst.com.
This article by Simply Wall St is general in nature. We provide commentary based on historical data and analyst forecasts only using an unbiased methodology and our articles are not intended to be financial advice. It does not constitute a recommendation to buy or sell any stock, and does not take account of your objectives, or your financial situation. We aim to bring you long-term focused analysis driven by fundamental data. Note that our analysis may not factor in the latest price-sensitive company announcements or qualitative material. Simply Wall St has no position in any stocks mentioned.
