
 Yahoo Finance
 A Sliding Share Price Has Us Looking At Macquarie Group Limited's (ASX:MQG) P/E Ratio

Unfortunately for some shareholders, the Macquarie Group (ASX:MQG) share price has dived 31% in the last thirty days. The recent drop has obliterated the annual return, with the share price now down 20% over that longer period.
All else being equal, a share price drop should make a stock more attractive to potential investors. While the market sentiment towards a stock is very changeable, in the long run, the share price will tend to move in the same direction as earnings per share. The implication here is that long term investors have an opportunity when expectations of a company are too low. Perhaps the simplest way to get a read on investors' expectations of a business is to look at its Price to Earnings Ratio (PE Ratio). Investors have optimistic expectations of companies with higher P/E ratios, compared to companies with lower P/E ratios.
Check out our latest analysis for Macquarie Group
Does Macquarie Group Have A Relatively High Or Low P/E For Its Industry?
Macquarie Group's P/E of 11.08 indicates relatively low sentiment towards the stock. We can see in the image below that the average P/E (17.9) for companies in the capital markets industry is higher than Macquarie Group's P/E.
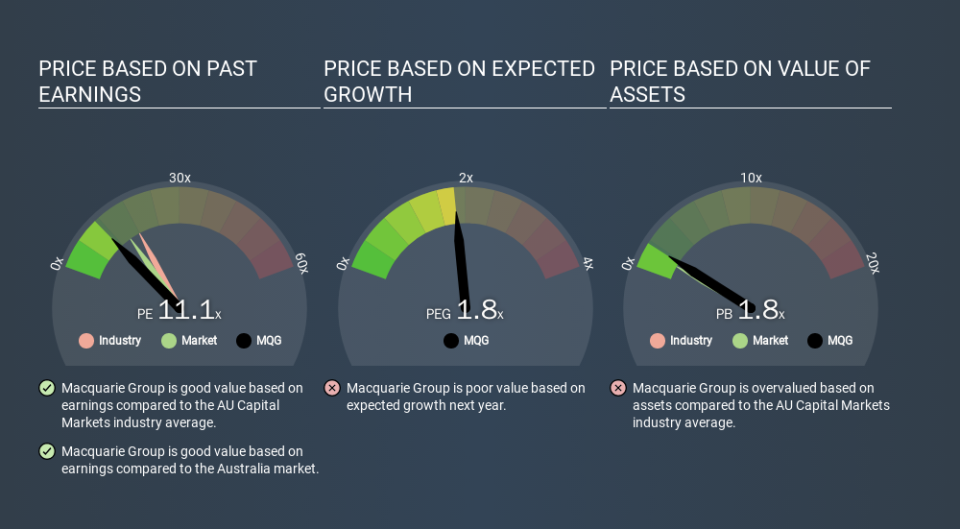
Its relatively low P/E ratio indicates that Macquarie Group shareholders think it will struggle to do as well as other companies in its industry classification. Many investors like to buy stocks when the market is pessimistic about their prospects. If you consider the stock interesting, further research is recommended. For example, I often monitor director buying and selling.
How Growth Rates Impact P/E Ratios
Probably the most important factor in determining what P/E a company trades on is the earnings growth. Earnings growth means that in the future the 'E' will be higher. And in that case, the P/E ratio itself will drop rather quickly. So while a stock may look expensive based on past earnings, it could be cheap based on future earnings.
It's great to see that Macquarie Group grew EPS by 19% in the last year. And its annual EPS growth rate over 5 years is 16%. So one might expect an above average P/E ratio.
Don't Forget: The P/E Does Not Account For Debt or Bank Deposits
It's important to note that the P/E ratio considers the market capitalization, not the enterprise value. That means it doesn't take debt or cash into account. Theoretically, a business can improve its earnings (and produce a lower P/E in the future) by investing in growth. That means taking on debt (or spending its cash).
Such expenditure might be good or bad, in the long term, but the point here is that the balance sheet is not reflected by this ratio.
Is Debt Impacting Macquarie Group's P/E?
Macquarie Group's net debt is considerable, at 110% of its market cap. This is a relatively high level of debt, so the stock probably deserves a relatively low P/E ratio. Keep that in mind when comparing it to other companies.
The Bottom Line On Macquarie Group's P/E Ratio
Macquarie Group has a P/E of 11.1. That's below the average in the AU market, which is 14.9. The company may have significant debt, but EPS growth was good last year. If it continues to grow, then the current low P/E may prove to be unjustified. What can be absolutely certain is that the market has become less optimistic about Macquarie Group over the last month, with the P/E ratio falling from 16.1 back then to 11.1 today. For those who prefer to invest with the flow of momentum, that might be a bad sign, but for a contrarian, it may signal opportunity.
Investors should be looking to buy stocks that the market is wrong about. If the reality for a company is not as bad as the P/E ratio indicates, then the share price should increase as the market realizes this. So this free visualization of the analyst consensus on future earnings could help you make the right decision about whether to buy, sell, or hold.
But note: Macquarie Group may not be the best stock to buy. So take a peek at this free list of interesting companies with strong recent earnings growth (and a P/E ratio below 20).
If you spot an error that warrants correction, please contact the editor at editorial-team@simplywallst.com. This article by Simply Wall St is general in nature. It does not constitute a recommendation to buy or sell any stock, and does not take account of your objectives, or your financial situation. Simply Wall St has no position in the stocks mentioned.
We aim to bring you long-term focused research analysis driven by fundamental data. Note that our analysis may not factor in the latest price-sensitive company announcements or qualitative material. Thank you for reading.