
 Yahoo Finance
 A Sliding Share Price Has Us Looking At Centuria Capital Group's (ASX:CNI) P/E Ratio

Unfortunately for some shareholders, the Centuria Capital Group (ASX:CNI) share price has dived 48% in the last thirty days. Indeed, the recent drop has reduced the annual gain to a relatively sedate 2.9% over the last twelve months.
Assuming nothing else has changed, a lower share price makes a stock more attractive to potential buyers. While the market sentiment towards a stock is very changeable, in the long run, the share price will tend to move in the same direction as earnings per share. So, on certain occasions, long term focussed investors try to take advantage of pessimistic expectations to buy shares at a better price. One way to gauge market expectations of a stock is to look at its Price to Earnings Ratio (PE Ratio). Investors have optimistic expectations of companies with higher P/E ratios, compared to companies with lower P/E ratios.
Check out our latest analysis for Centuria Capital Group
How Does Centuria Capital Group's P/E Ratio Compare To Its Peers?
Centuria Capital Group's P/E of 28.01 indicates some degree of optimism towards the stock. As you can see below, Centuria Capital Group has a higher P/E than the average company (12.5) in the capital markets industry.
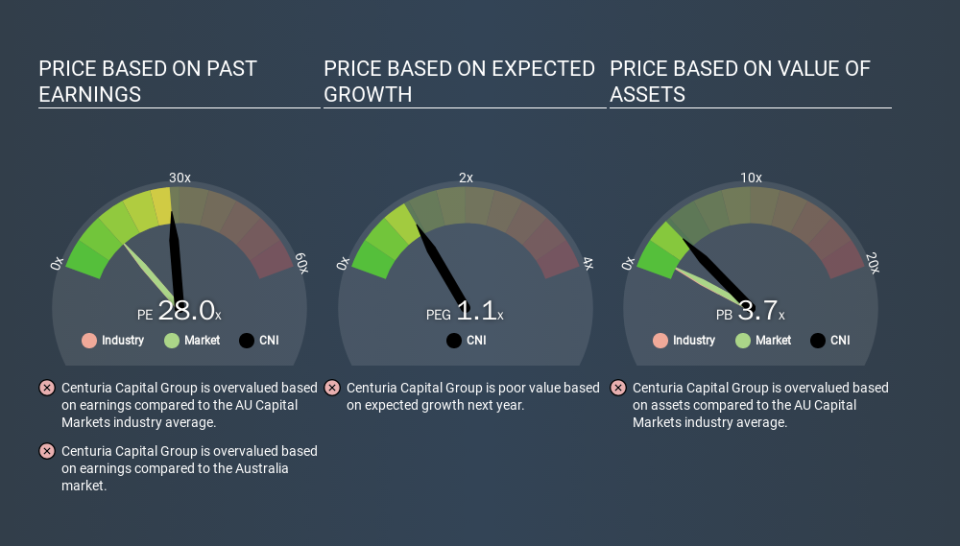
Its relatively high P/E ratio indicates that Centuria Capital Group shareholders think it will perform better than other companies in its industry classification. Shareholders are clearly optimistic, but the future is always uncertain. So investors should delve deeper. I like to check if company insiders have been buying or selling.
How Growth Rates Impact P/E Ratios
Earnings growth rates have a big influence on P/E ratios. Earnings growth means that in the future the 'E' will be higher. Therefore, even if you pay a high multiple of earnings now, that multiple will become lower in the future. So while a stock may look expensive based on past earnings, it could be cheap based on future earnings.
In the last year, Centuria Capital Group grew EPS like Taylor Swift grew her fan base back in 2010; the 119% gain was both fast and well deserved. Even better, EPS is up 23% per year over three years. So we'd absolutely expect it to have a relatively high P/E ratio. Regrettably, the longer term performance is poor, with EPS down 19% per year over 5 years.
Remember: P/E Ratios Don't Consider The Balance Sheet
Don't forget that the P/E ratio considers market capitalization. In other words, it does not consider any debt or cash that the company may have on the balance sheet. Theoretically, a business can improve its earnings (and produce a lower P/E in the future) by investing in growth. That means taking on debt (or spending its cash).
Such expenditure might be good or bad, in the long term, but the point here is that the balance sheet is not reflected by this ratio.
So What Does Centuria Capital Group's Balance Sheet Tell Us?
With net cash of AU$361m, Centuria Capital Group has a very strong balance sheet, which may be important for its business. Having said that, at 45% of its market capitalization the cash hoard would contribute towards a higher P/E ratio.
The Verdict On Centuria Capital Group's P/E Ratio
Centuria Capital Group's P/E is 28.0 which is above average (12.6) in its market. The excess cash it carries is the gravy on top its fast EPS growth. So based on this analysis we'd expect Centuria Capital Group to have a high P/E ratio. Given Centuria Capital Group's P/E ratio has declined from 53.7 to 28.0 in the last month, we know for sure that the market is significantly less confident about the business today, than it was back then. For those who prefer to invest with the flow of momentum, that might be a bad sign, but for a contrarian, it may signal opportunity.
Investors have an opportunity when market expectations about a stock are wrong. As value investor Benjamin Graham famously said, 'In the short run, the market is a voting machine but in the long run, it is a weighing machine. So this free visualization of the analyst consensus on future earnings could help you make the right decision about whether to buy, sell, or hold.
Of course, you might find a fantastic investment by looking at a few good candidates. So take a peek at this free list of companies with modest (or no) debt, trading on a P/E below 20.
If you spot an error that warrants correction, please contact the editor at editorial-team@simplywallst.com. This article by Simply Wall St is general in nature. It does not constitute a recommendation to buy or sell any stock, and does not take account of your objectives, or your financial situation. Simply Wall St has no position in the stocks mentioned.
We aim to bring you long-term focused research analysis driven by fundamental data. Note that our analysis may not factor in the latest price-sensitive company announcements or qualitative material. Thank you for reading.
