
 Yahoo Finance
 A Sliding Share Price Has Us Looking At KB Home's (NYSE:KBH) P/E Ratio
To the annoyance of some shareholders, KB Home (NYSE:KBH) shares are down a considerable 32% in the last month. Looking back over the last year, the stock has been a solid performer, with a gain of 13%.
All else being equal, a share price drop should make a stock more attractive to potential investors. In the long term, share prices tend to follow earnings per share, but in the short term prices bounce around in response to short term factors (which are not always obvious). The implication here is that long term investors have an opportunity when expectations of a company are too low. One way to gauge market expectations of a stock is to look at its Price to Earnings Ratio (PE Ratio). Investors have optimistic expectations of companies with higher P/E ratios, compared to companies with lower P/E ratios.
Check out our latest analysis for KB Home
How Does KB Home's P/E Ratio Compare To Its Peers?
KB Home's P/E of 8.80 indicates relatively low sentiment towards the stock. If you look at the image below, you can see KB Home has a lower P/E than the average (10.2) in the consumer durables industry classification.
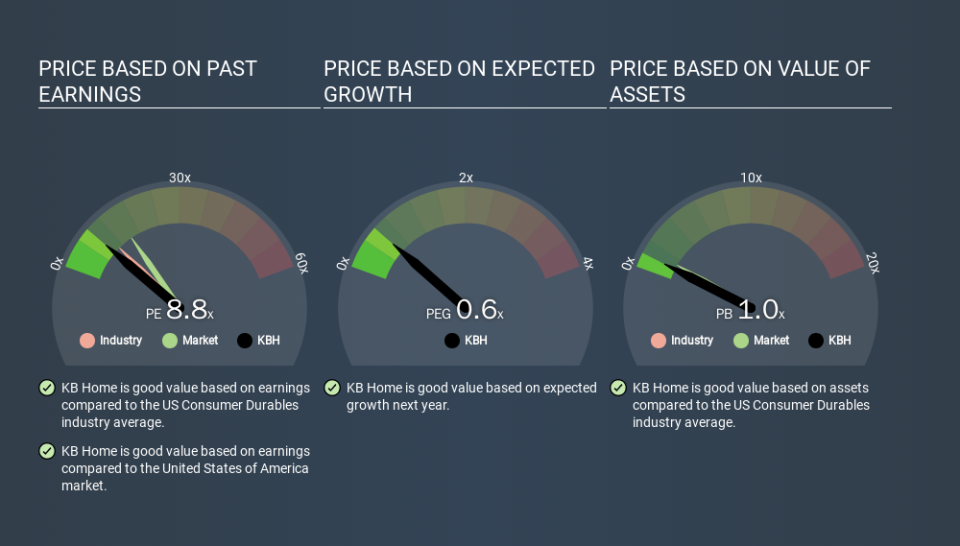
KB Home's P/E tells us that market participants think it will not fare as well as its peers in the same industry. While current expectations are low, the stock could be undervalued if the situation is better than the market assumes. If you consider the stock interesting, further research is recommended. For example, I often monitor director buying and selling.
How Growth Rates Impact P/E Ratios
Probably the most important factor in determining what P/E a company trades on is the earnings growth. Earnings growth means that in the future the 'E' will be higher. And in that case, the P/E ratio itself will drop rather quickly. A lower P/E should indicate the stock is cheap relative to others -- and that may attract buyers.
KB Home's earnings made like a rocket, taking off 57% last year. Even better, EPS is up 35% per year over three years. So we'd absolutely expect it to have a relatively high P/E ratio. Unfortunately, earnings per share are down 22% a year, over 5 years.
Remember: P/E Ratios Don't Consider The Balance Sheet
It's important to note that the P/E ratio considers the market capitalization, not the enterprise value. That means it doesn't take debt or cash into account. Theoretically, a business can improve its earnings (and produce a lower P/E in the future) by investing in growth. That means taking on debt (or spending its cash).
Spending on growth might be good or bad a few years later, but the point is that the P/E ratio does not account for the option (or lack thereof).
So What Does KB Home's Balance Sheet Tell Us?
KB Home's net debt is 54% of its market cap. If you want to compare its P/E ratio to other companies, you should absolutely keep in mind it has significant borrowings.
The Verdict On KB Home's P/E Ratio
KB Home trades on a P/E ratio of 8.8, which is below the US market average of 14.7. The company may have significant debt, but EPS growth was good last year. The low P/E ratio suggests current market expectations are muted, implying these levels of growth will not continue. What can be absolutely certain is that the market has become more pessimistic about KB Home over the last month, with the P/E ratio falling from 12.9 back then to 8.8 today. For those who prefer invest in growth, this stock apparently offers limited promise, but the deep value investors may find the pessimism around this stock enticing.
Investors have an opportunity when market expectations about a stock are wrong. If it is underestimating a company, investors can make money by buying and holding the shares until the market corrects itself. So this free visualization of the analyst consensus on future earnings could help you make the right decision about whether to buy, sell, or hold.
But note: KB Home may not be the best stock to buy. So take a peek at this free list of interesting companies with strong recent earnings growth (and a P/E ratio below 20).
If you spot an error that warrants correction, please contact the editor at editorial-team@simplywallst.com. This article by Simply Wall St is general in nature. It does not constitute a recommendation to buy or sell any stock, and does not take account of your objectives, or your financial situation. Simply Wall St has no position in the stocks mentioned.
We aim to bring you long-term focused research analysis driven by fundamental data. Note that our analysis may not factor in the latest price-sensitive company announcements or qualitative material. Thank you for reading.
