
 Yahoo Finance
 A Sliding Share Price Has Us Looking At FIT Hon Teng Limited's (HKG:6088) P/E Ratio

To the annoyance of some shareholders, FIT Hon Teng (HKG:6088) shares are down a considerable 31% in the last month. That drop has capped off a tough year for shareholders, with the share price down 55% in that time.
Assuming nothing else has changed, a lower share price makes a stock more attractive to potential buyers. In the long term, share prices tend to follow earnings per share, but in the short term prices bounce around in response to short term factors (which are not always obvious). The implication here is that long term investors have an opportunity when expectations of a company are too low. One way to gauge market expectations of a stock is to look at its Price to Earnings Ratio (PE Ratio). A high P/E implies that investors have high expectations of what a company can achieve compared to a company with a low P/E ratio.
Check out our latest analysis for FIT Hon Teng
Does FIT Hon Teng Have A Relatively High Or Low P/E For Its Industry?
We can tell from its P/E ratio of 6.45 that sentiment around FIT Hon Teng isn't particularly high. If you look at the image below, you can see FIT Hon Teng has a lower P/E than the average (7.8) in the electronic industry classification.
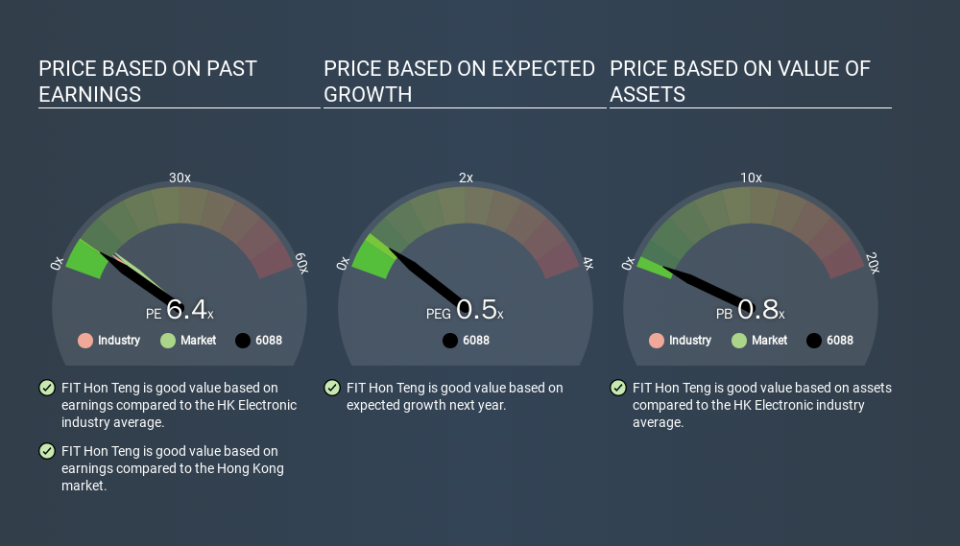
This suggests that market participants think FIT Hon Teng will underperform other companies in its industry. Many investors like to buy stocks when the market is pessimistic about their prospects. It is arguably worth checking if insiders are buying shares, because that might imply they believe the stock is undervalued.
How Growth Rates Impact P/E Ratios
Probably the most important factor in determining what P/E a company trades on is the earnings growth. That's because companies that grow earnings per share quickly will rapidly increase the 'E' in the equation. And in that case, the P/E ratio itself will drop rather quickly. Then, a lower P/E should attract more buyers, pushing the share price up.
FIT Hon Teng increased earnings per share by 4.7% last year. And its annual EPS growth rate over 3 years is 2.5%.
Remember: P/E Ratios Don't Consider The Balance Sheet
Don't forget that the P/E ratio considers market capitalization. That means it doesn't take debt or cash into account. In theory, a company can lower its future P/E ratio by using cash or debt to invest in growth.
Such expenditure might be good or bad, in the long term, but the point here is that the balance sheet is not reflected by this ratio.
Is Debt Impacting FIT Hon Teng's P/E?
FIT Hon Teng has net cash of US$182m. This is fairly high at 12% of its market capitalization. That might mean balance sheet strength is important to the business, but should also help push the P/E a bit higher than it would otherwise be.
The Bottom Line On FIT Hon Teng's P/E Ratio
FIT Hon Teng has a P/E of 6.4. That's below the average in the HK market, which is 8.8. Recent earnings growth wasn't bad. And the net cash position gives the company many options. So it's strange that the low P/E indicates low expectations. Since analysts are predicting growth will continue, one might expect to see a higher P/E so it may be worth looking closer. What can be absolutely certain is that the market has become more pessimistic about FIT Hon Teng over the last month, with the P/E ratio falling from 9.4 back then to 6.4 today. For those who prefer invest in growth, this stock apparently offers limited promise, but the deep value investors may find the pessimism around this stock enticing.
Investors should be looking to buy stocks that the market is wrong about. If it is underestimating a company, investors can make money by buying and holding the shares until the market corrects itself. So this free visualization of the analyst consensus on future earnings could help you make the right decision about whether to buy, sell, or hold.
You might be able to find a better buy than FIT Hon Teng. If you want a selection of possible winners, check out this free list of interesting companies that trade on a P/E below 20 (but have proven they can grow earnings).
If you spot an error that warrants correction, please contact the editor at editorial-team@simplywallst.com. This article by Simply Wall St is general in nature. It does not constitute a recommendation to buy or sell any stock, and does not take account of your objectives, or your financial situation. Simply Wall St has no position in the stocks mentioned.
We aim to bring you long-term focused research analysis driven by fundamental data. Note that our analysis may not factor in the latest price-sensitive company announcements or qualitative material. Thank you for reading.
