
 Yahoo Finance
 SKY Network Television's (NZSE:SKT) Returns On Capital Are Heading Higher
If you're not sure where to start when looking for the next multi-bagger, there are a few key trends you should keep an eye out for. Ideally, a business will show two trends; firstly a growing return on capital employed (ROCE) and secondly, an increasing amount of capital employed. Ultimately, this demonstrates that it's a business that is reinvesting profits at increasing rates of return. So on that note, SKY Network Television (NZSE:SKT) looks quite promising in regards to its trends of return on capital.
Understanding Return On Capital Employed (ROCE)
Just to clarify if you're unsure, ROCE is a metric for evaluating how much pre-tax income (in percentage terms) a company earns on the capital invested in its business. Analysts use this formula to calculate it for SKY Network Television:
Return on Capital Employed = Earnings Before Interest and Tax (EBIT) ÷ (Total Assets - Current Liabilities)
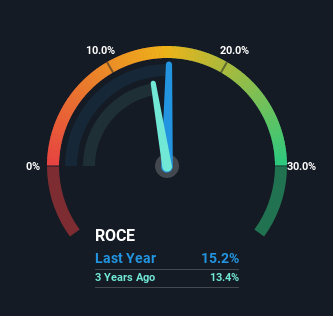
0.15 = NZ$69m ÷ (NZ$679m - NZ$226m) (Based on the trailing twelve months to December 2022).
So, SKY Network Television has an ROCE of 15%. In absolute terms, that's a pretty normal return, and it's somewhat close to the Media industry average of 14%.
See our latest analysis for SKY Network Television
In the above chart we have measured SKY Network Television's prior ROCE against its prior performance, but the future is arguably more important. If you'd like, you can check out the forecasts from the analysts covering SKY Network Television here for free.
What The Trend Of ROCE Can Tell Us
SKY Network Television has not disappointed in regards to ROCE growth. We found that the returns on capital employed over the last five years have risen by 34%. That's a very favorable trend because this means that the company is earning more per dollar of capital that's being employed. In regards to capital employed, SKY Network Television appears to been achieving more with less, since the business is using 73% less capital to run its operation. If this trend continues, the business might be getting more efficient but it's shrinking in terms of total assets.
On a side note, we noticed that the improvement in ROCE appears to be partly fueled by an increase in current liabilities. The current liabilities has increased to 33% of total assets, so the business is now more funded by the likes of its suppliers or short-term creditors. Keep an eye out for future increases because when the ratio of current liabilities to total assets gets particularly high, this can introduce some new risks for the business.
In Conclusion...
In a nutshell, we're pleased to see that SKY Network Television has been able to generate higher returns from less capital. However the stock is down a substantial 75% in the last five years so there could be other areas of the business hurting its prospects. Regardless, we think the underlying fundamentals warrant this stock for further investigation.
One more thing: We've identified 3 warning signs with SKY Network Television (at least 1 which shouldn't be ignored) , and understanding them would certainly be useful.
For those who like to invest in solid companies, check out this free list of companies with solid balance sheets and high returns on equity.
Have feedback on this article? Concerned about the content? Get in touch with us directly. Alternatively, email editorial-team (at) simplywallst.com.
This article by Simply Wall St is general in nature. We provide commentary based on historical data and analyst forecasts only using an unbiased methodology and our articles are not intended to be financial advice. It does not constitute a recommendation to buy or sell any stock, and does not take account of your objectives, or your financial situation. We aim to bring you long-term focused analysis driven by fundamental data. Note that our analysis may not factor in the latest price-sensitive company announcements or qualitative material. Simply Wall St has no position in any stocks mentioned.
Join A Paid User Research Session
You’ll receive a US$30 Amazon Gift card for 1 hour of your time while helping us build better investing tools for the individual investors like yourself. Sign up here
