
 Yahoo Finance
 Six Flags Entertainment's (NYSE:SIX) Returns On Capital Are Heading Higher
Did you know there are some financial metrics that can provide clues of a potential multi-bagger? One common approach is to try and find a company with returns on capital employed (ROCE) that are increasing, in conjunction with a growing amount of capital employed. Put simply, these types of businesses are compounding machines, meaning they are continually reinvesting their earnings at ever-higher rates of return. With that in mind, we've noticed some promising trends at Six Flags Entertainment (NYSE:SIX) so let's look a bit deeper.
What is Return On Capital Employed (ROCE)?
For those that aren't sure what ROCE is, it measures the amount of pre-tax profits a company can generate from the capital employed in its business. To calculate this metric for Six Flags Entertainment, this is the formula:
Return on Capital Employed = Earnings Before Interest and Tax (EBIT) ÷ (Total Assets - Current Liabilities)
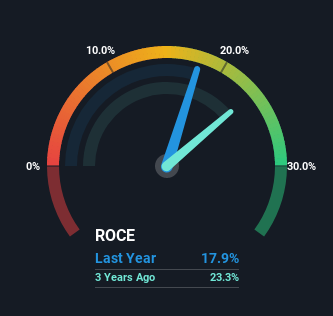
0.18 = US$436m ÷ (US$2.9b - US$444m) (Based on the trailing twelve months to April 2022).
Thus, Six Flags Entertainment has an ROCE of 18%. On its own, that's a standard return, however it's much better than the 9.9% generated by the Hospitality industry.
See our latest analysis for Six Flags Entertainment
In the above chart we have measured Six Flags Entertainment's prior ROCE against its prior performance, but the future is arguably more important. If you'd like to see what analysts are forecasting going forward, you should check out our free report for Six Flags Entertainment.
What Does the ROCE Trend For Six Flags Entertainment Tell Us?
Six Flags Entertainment has not disappointed with their ROCE growth. Looking at the data, we can see that even though capital employed in the business has remained relatively flat, the ROCE generated has risen by 22% over the last five years. Basically the business is generating higher returns from the same amount of capital and that is proof that there are improvements in the company's efficiencies. It's worth looking deeper into this though because while it's great that the business is more efficient, it might also mean that going forward the areas to invest internally for the organic growth are lacking.
The Bottom Line
To sum it up, Six Flags Entertainment is collecting higher returns from the same amount of capital, and that's impressive. Given the stock has declined 44% in the last five years, this could be a good investment if the valuation and other metrics are also appealing. So researching this company further and determining whether or not these trends will continue seems justified.
One more thing: We've identified 3 warning signs with Six Flags Entertainment (at least 2 which don't sit too well with us) , and understanding them would certainly be useful.
For those who like to invest in solid companies, check out this free list of companies with solid balance sheets and high returns on equity.
Have feedback on this article? Concerned about the content? Get in touch with us directly. Alternatively, email editorial-team (at) simplywallst.com.
This article by Simply Wall St is general in nature. We provide commentary based on historical data and analyst forecasts only using an unbiased methodology and our articles are not intended to be financial advice. It does not constitute a recommendation to buy or sell any stock, and does not take account of your objectives, or your financial situation. We aim to bring you long-term focused analysis driven by fundamental data. Note that our analysis may not factor in the latest price-sensitive company announcements or qualitative material. Simply Wall St has no position in any stocks mentioned.
