
 Yahoo Finance
 Singapore Exchange's (SGX:S68) five-year earnings growth trails the respectable shareholder returns
Generally speaking the aim of active stock picking is to find companies that provide returns that are superior to the market average. And the truth is, you can make significant gains if you buy good quality businesses at the right price. For example, long term Singapore Exchange Limited (SGX:S68) shareholders have enjoyed a 27% share price rise over the last half decade, well in excess of the market decline of around 25% (not including dividends). On the other hand, the more recent gains haven't been so impressive, with shareholders gaining just 1.3% , including dividends .
Since it's been a strong week for Singapore Exchange shareholders, let's have a look at trend of the longer term fundamentals.
Check out our latest analysis for Singapore Exchange
While the efficient markets hypothesis continues to be taught by some, it has been proven that markets are over-reactive dynamic systems, and investors are not always rational. One imperfect but simple way to consider how the market perception of a company has shifted is to compare the change in the earnings per share (EPS) with the share price movement.
During five years of share price growth, Singapore Exchange achieved compound earnings per share (EPS) growth of 8.9% per year. The EPS growth is more impressive than the yearly share price gain of 5% over the same period. So one could conclude that the broader market has become more cautious towards the stock.
The graphic below depicts how EPS has changed over time (unveil the exact values by clicking on the image).
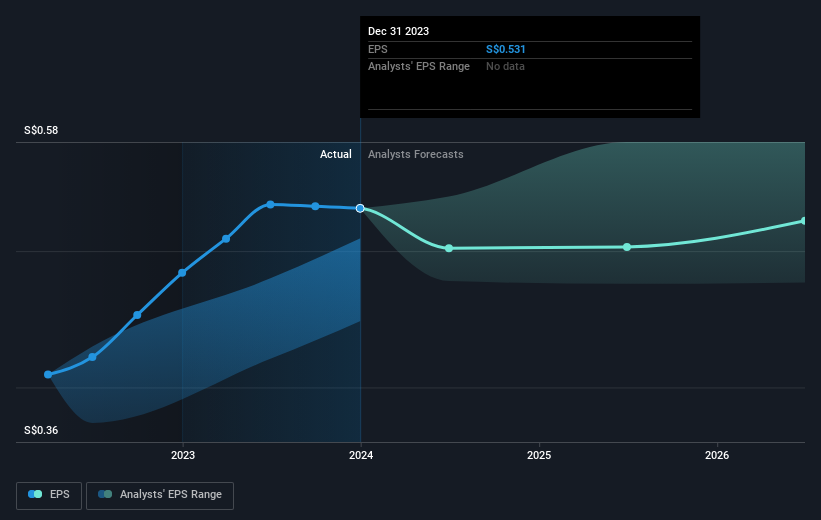
This free interactive report on Singapore Exchange's earnings, revenue and cash flow is a great place to start, if you want to investigate the stock further.
What About Dividends?
As well as measuring the share price return, investors should also consider the total shareholder return (TSR). The TSR is a return calculation that accounts for the value of cash dividends (assuming that any dividend received was reinvested) and the calculated value of any discounted capital raisings and spin-offs. It's fair to say that the TSR gives a more complete picture for stocks that pay a dividend. In the case of Singapore Exchange, it has a TSR of 51% for the last 5 years. That exceeds its share price return that we previously mentioned. This is largely a result of its dividend payments!
A Different Perspective
We're pleased to report that Singapore Exchange shareholders have received a total shareholder return of 1.3% over one year. And that does include the dividend. However, the TSR over five years, coming in at 9% per year, is even more impressive. The pessimistic view would be that be that the stock has its best days behind it, but on the other hand the price might simply be moderating while the business itself continues to execute. Keeping this in mind, a solid next step might be to take a look at Singapore Exchange's dividend track record. This free interactive graph is a great place to start.
Of course Singapore Exchange may not be the best stock to buy. So you may wish to see this free collection of growth stocks.
Please note, the market returns quoted in this article reflect the market weighted average returns of stocks that currently trade on Singaporean exchanges.
Have feedback on this article? Concerned about the content? Get in touch with us directly. Alternatively, email editorial-team (at) simplywallst.com.
This article by Simply Wall St is general in nature. We provide commentary based on historical data and analyst forecasts only using an unbiased methodology and our articles are not intended to be financial advice. It does not constitute a recommendation to buy or sell any stock, and does not take account of your objectives, or your financial situation. We aim to bring you long-term focused analysis driven by fundamental data. Note that our analysis may not factor in the latest price-sensitive company announcements or qualitative material. Simply Wall St has no position in any stocks mentioned.
