
 Yahoo Finance
 Simpson Manufacturing's (NYSE:SSD) five-year earnings growth trails the 23% YoY shareholder returns
When you buy shares in a company, it's worth keeping in mind the possibility that it could fail, and you could lose your money. But on the bright side, you can make far more than 100% on a really good stock. For example, the Simpson Manufacturing Co., Inc. (NYSE:SSD) share price has soared 166% in the last half decade. Most would be very happy with that. And in the last week the share price has popped 6.0%.
Since the stock has added US$278m to its market cap in the past week alone, let's see if underlying performance has been driving long-term returns.
Check out our latest analysis for Simpson Manufacturing
To quote Buffett, 'Ships will sail around the world but the Flat Earth Society will flourish. There will continue to be wide discrepancies between price and value in the marketplace...' One flawed but reasonable way to assess how sentiment around a company has changed is to compare the earnings per share (EPS) with the share price.
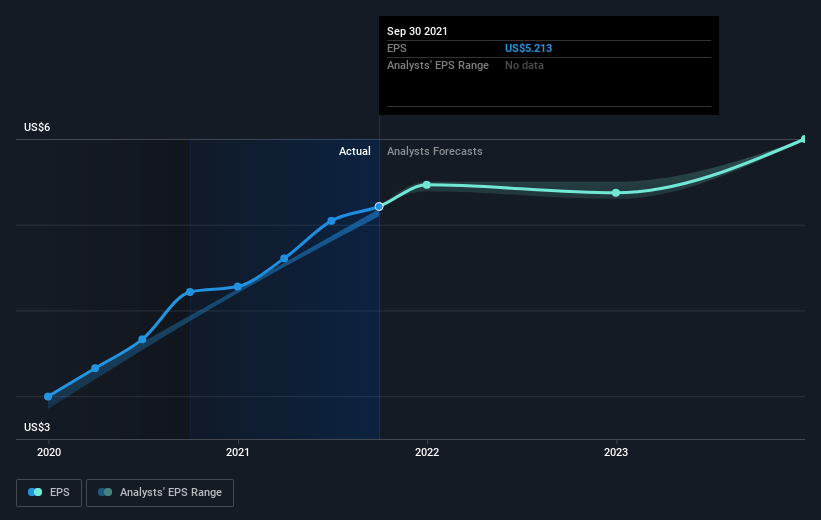
During five years of share price growth, Simpson Manufacturing achieved compound earnings per share (EPS) growth of 24% per year. This EPS growth is reasonably close to the 22% average annual increase in the share price. This indicates that investor sentiment towards the company has not changed a great deal. Indeed, it would appear the share price is reacting to the EPS.
The graphic below depicts how EPS has changed over time (unveil the exact values by clicking on the image).
We know that Simpson Manufacturing has improved its bottom line lately, but is it going to grow revenue? This free report showing analyst revenue forecasts should help you figure out if the EPS growth can be sustained.
What About Dividends?
It is important to consider the total shareholder return, as well as the share price return, for any given stock. Whereas the share price return only reflects the change in the share price, the TSR includes the value of dividends (assuming they were reinvested) and the benefit of any discounted capital raising or spin-off. Arguably, the TSR gives a more comprehensive picture of the return generated by a stock. We note that for Simpson Manufacturing the TSR over the last 5 years was 185%, which is better than the share price return mentioned above. This is largely a result of its dividend payments!
A Different Perspective
Simpson Manufacturing shareholders gained a total return of 21% during the year. But that return falls short of the market. It's probably a good sign that the company has an even better long term track record, having provided shareholders with an annual TSR of 23% over five years. Maybe the share price is just taking a breather while the business executes on its growth strategy. Before spending more time on Simpson Manufacturing it might be wise to click here to see if insiders have been buying or selling shares.
For those who like to find winning investments this free list of growing companies with recent insider purchasing, could be just the ticket.
Please note, the market returns quoted in this article reflect the market weighted average returns of stocks that currently trade on US exchanges.
This article by Simply Wall St is general in nature. We provide commentary based on historical data and analyst forecasts only using an unbiased methodology and our articles are not intended to be financial advice. It does not constitute a recommendation to buy or sell any stock, and does not take account of your objectives, or your financial situation. We aim to bring you long-term focused analysis driven by fundamental data. Note that our analysis may not factor in the latest price-sensitive company announcements or qualitative material. Simply Wall St has no position in any stocks mentioned.
Have feedback on this article? Concerned about the content? Get in touch with us directly. Alternatively, email editorial-team (at) simplywallst.com.
