
 Yahoo Finance
 SILK Laser Australia (ASX:SLA) stock falls 12% in past week as one-year earnings and shareholder returns continue downward trend
Investing in stocks comes with the risk that the share price will fall. And there's no doubt that SILK Laser Australia Limited (ASX:SLA) stock has had a really bad year. The share price is down a hefty 54% in that time. Because SILK Laser Australia hasn't been listed for many years, the market is still learning about how the business performs. The falls have accelerated recently, with the share price down 43% in the last three months.
With the stock having lost 12% in the past week, it's worth taking a look at business performance and seeing if there's any red flags.
View our latest analysis for SILK Laser Australia
There is no denying that markets are sometimes efficient, but prices do not always reflect underlying business performance. By comparing earnings per share (EPS) and share price changes over time, we can get a feel for how investor attitudes to a company have morphed over time.
Unhappily, SILK Laser Australia had to report a 32% decline in EPS over the last year. This reduction in EPS is not as bad as the 54% share price fall. Unsurprisingly, given the lack of EPS growth, the market seems to be more cautious about the stock.
You can see below how EPS has changed over time (discover the exact values by clicking on the image).
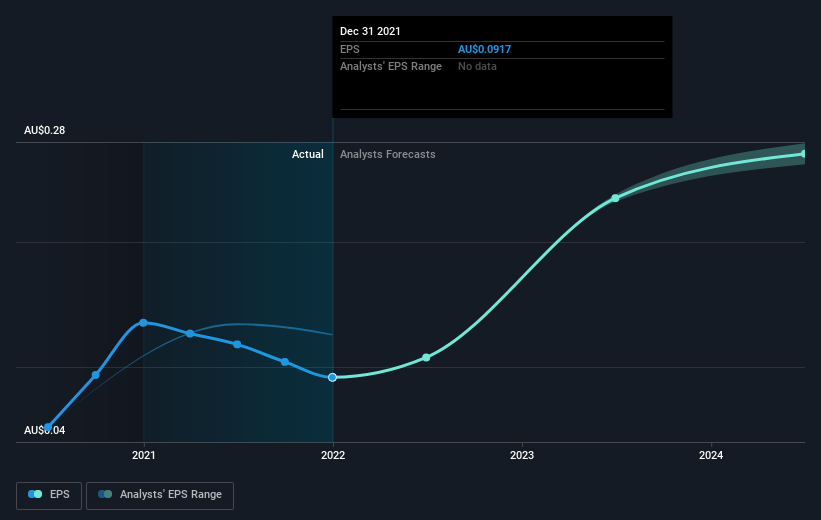
This free interactive report on SILK Laser Australia's earnings, revenue and cash flow is a great place to start, if you want to investigate the stock further.
A Different Perspective
SILK Laser Australia shareholders are down 54% for the year, even worse than the market loss of 6.8%. That's disappointing, but it's worth keeping in mind that the market-wide selling wouldn't have helped. The share price decline has continued throughout the most recent three months, down 43%, suggesting an absence of enthusiasm from investors. Given the relatively short history of this stock, we'd remain pretty wary until we see some strong business performance. It's always interesting to track share price performance over the longer term. But to understand SILK Laser Australia better, we need to consider many other factors. For instance, we've identified 5 warning signs for SILK Laser Australia that you should be aware of.
Of course SILK Laser Australia may not be the best stock to buy. So you may wish to see this free collection of growth stocks.
Please note, the market returns quoted in this article reflect the market weighted average returns of stocks that currently trade on AU exchanges.
Have feedback on this article? Concerned about the content? Get in touch with us directly. Alternatively, email editorial-team (at) simplywallst.com.
This article by Simply Wall St is general in nature. We provide commentary based on historical data and analyst forecasts only using an unbiased methodology and our articles are not intended to be financial advice. It does not constitute a recommendation to buy or sell any stock, and does not take account of your objectives, or your financial situation. We aim to bring you long-term focused analysis driven by fundamental data. Note that our analysis may not factor in the latest price-sensitive company announcements or qualitative material. Simply Wall St has no position in any stocks mentioned.
