
 Yahoo Finance
 Shareholders of Yihai International Holding (HKG:1579) Must Be Ecstatic With Their 1658% Total Return

Generally speaking, investors are inspired to be stock pickers by the potential to find the big winners. Mistakes are inevitable, but a single top stock pick can cover any losses, and so much more. For example, the Yihai International Holding Ltd. (HKG:1579) share price is up a whopping 1622% in the last three years, a handsome return for long term holders. On top of that, the share price is up 32% in about a quarter.
We love happy stories like this one. The company should be really proud of that performance!
View our latest analysis for Yihai International Holding
While the efficient markets hypothesis continues to be taught by some, it has been proven that markets are over-reactive dynamic systems, and investors are not always rational. One flawed but reasonable way to assess how sentiment around a company has changed is to compare the earnings per share (EPS) with the share price.
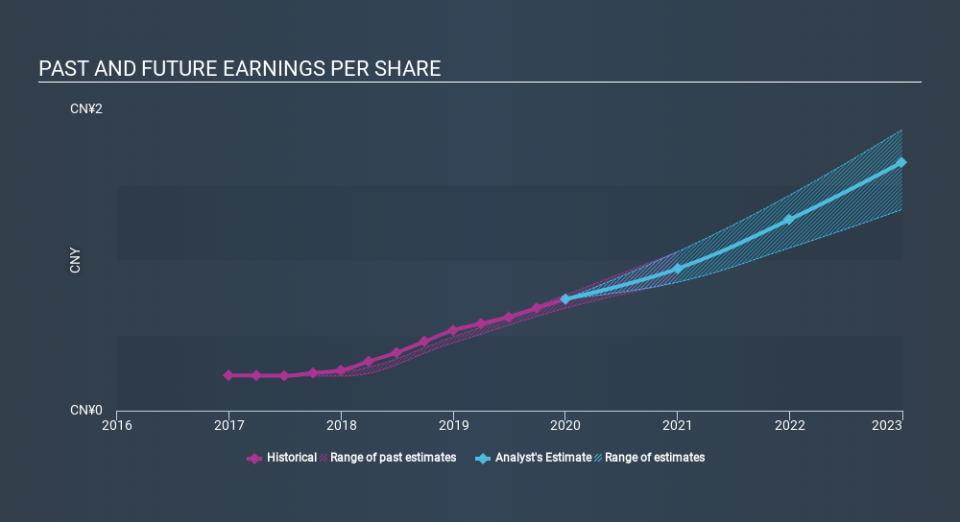
Yihai International Holding was able to grow its EPS at 47% per year over three years, sending the share price higher. This EPS growth is lower than the 158% average annual increase in the share price. So it's fair to assume the market has a higher opinion of the business than it did three years ago. That's not necessarily surprising considering the three-year track record of earnings growth. This favorable sentiment is reflected in its (fairly optimistic) P/E ratio of 82.24.
The graphic below depicts how EPS has changed over time (unveil the exact values by clicking on the image).
We know that Yihai International Holding has improved its bottom line over the last three years, but what does the future have in store? You can see how its balance sheet has strengthened (or weakened) over time in this free interactive graphic.
What About Dividends?
As well as measuring the share price return, investors should also consider the total shareholder return (TSR). Whereas the share price return only reflects the change in the share price, the TSR includes the value of dividends (assuming they were reinvested) and the benefit of any discounted capital raising or spin-off. It's fair to say that the TSR gives a more complete picture for stocks that pay a dividend. We note that for Yihai International Holding the TSR over the last 3 years was 1658%, which is better than the share price return mentioned above. The dividends paid by the company have thusly boosted the total shareholder return.
A Different Perspective
We're pleased to report that Yihai International Holding rewarded shareholders with a total shareholder return of 79% over the last year. That includes the value of the dividend. But the three year TSR of 160% per year is even better. It's always interesting to track share price performance over the longer term. But to understand Yihai International Holding better, we need to consider many other factors. Even so, be aware that Yihai International Holding is showing 1 warning sign in our investment analysis , you should know about...
If you like to buy stocks alongside management, then you might just love this free list of companies. (Hint: insiders have been buying them).
Please note, the market returns quoted in this article reflect the market weighted average returns of stocks that currently trade on HK exchanges.
Love or hate this article? Concerned about the content? Get in touch with us directly. Alternatively, email editorial-team@simplywallst.com.
This article by Simply Wall St is general in nature. It does not constitute a recommendation to buy or sell any stock, and does not take account of your objectives, or your financial situation. We aim to bring you long-term focused analysis driven by fundamental data. Note that our analysis may not factor in the latest price-sensitive company announcements or qualitative material. Simply Wall St has no position in any stocks mentioned. Thank you for reading.
