
 Yahoo Finance
 Shareholders in Trinity Exploration & Production (LON:TRIN) are in the red if they invested five years ago
Ideally, your overall portfolio should beat the market average. But even the best stock picker will only win with some selections. So we wouldn't blame long term Trinity Exploration & Production plc (LON:TRIN) shareholders for doubting their decision to hold, with the stock down 34% over a half decade. Furthermore, it's down 20% in about a quarter. That's not much fun for holders.
Since shareholders are down over the longer term, lets look at the underlying fundamentals over the that time and see if they've been consistent with returns.
See our latest analysis for Trinity Exploration & Production
To paraphrase Benjamin Graham: Over the short term the market is a voting machine, but over the long term it's a weighing machine. One flawed but reasonable way to assess how sentiment around a company has changed is to compare the earnings per share (EPS) with the share price.
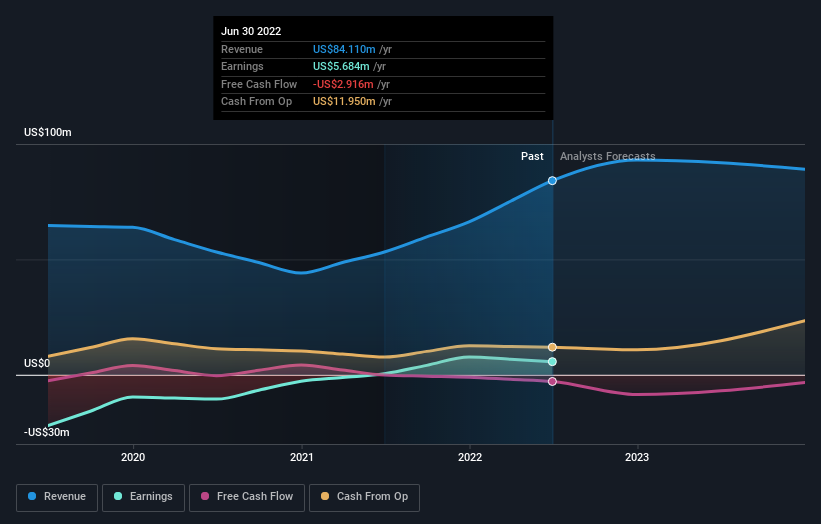
Trinity Exploration & Production became profitable within the last five years. Most would consider that to be a good thing, so it's counter-intuitive to see the share price declining. Other metrics might give us a better handle on how its value is changing over time.
Revenue is actually up 7.0% over the time period. A more detailed examination of the revenue and earnings may or may not explain why the share price languishes; there could be an opportunity.
The graphic below depicts how earnings and revenue have changed over time (unveil the exact values by clicking on the image).
It is of course excellent to see how Trinity Exploration & Production has grown profits over the years, but the future is more important for shareholders. It might be well worthwhile taking a look at our free report on how its financial position has changed over time.
A Different Perspective
We regret to report that Trinity Exploration & Production shareholders are down 19% for the year. Unfortunately, that's worse than the broader market decline of 3.9%. However, it could simply be that the share price has been impacted by broader market jitters. It might be worth keeping an eye on the fundamentals, in case there's a good opportunity. Unfortunately, last year's performance may indicate unresolved challenges, given that it was worse than the annualised loss of 6% over the last half decade. We realise that Baron Rothschild has said investors should "buy when there is blood on the streets", but we caution that investors should first be sure they are buying a high quality business. While it is well worth considering the different impacts that market conditions can have on the share price, there are other factors that are even more important. Like risks, for instance. Every company has them, and we've spotted 2 warning signs for Trinity Exploration & Production (of which 1 shouldn't be ignored!) you should know about.
Of course Trinity Exploration & Production may not be the best stock to buy. So you may wish to see this free collection of growth stocks.
Please note, the market returns quoted in this article reflect the market weighted average returns of stocks that currently trade on GB exchanges.
Have feedback on this article? Concerned about the content? Get in touch with us directly. Alternatively, email editorial-team (at) simplywallst.com.
This article by Simply Wall St is general in nature. We provide commentary based on historical data and analyst forecasts only using an unbiased methodology and our articles are not intended to be financial advice. It does not constitute a recommendation to buy or sell any stock, and does not take account of your objectives, or your financial situation. We aim to bring you long-term focused analysis driven by fundamental data. Note that our analysis may not factor in the latest price-sensitive company announcements or qualitative material. Simply Wall St has no position in any stocks mentioned.
Join A Paid User Research Session
You’ll receive a US$30 Amazon Gift card for 1 hour of your time while helping us build better investing tools for the individual investors like yourself. Sign up here
