
 Yahoo Finance
 Would Shareholders Who Purchased IVE Group's(ASX:IGL) Stock Three Years Be Happy With The Share price Today?

Want to participate in a short research study? Help shape the future of investing tools and earn a $40 gift card!
If you are building a properly diversified stock portfolio, the chances are some of your picks will perform badly. But the last three years have been particularly tough on longer term IVE Group Limited (ASX:IGL) shareholders. Regrettably, they have had to cope with a 66% drop in the share price over that period. And the ride hasn't got any smoother in recent times over the last year, with the price 63% lower in that time. Even worse, it's down 25% in about a month, which isn't fun at all.
Check out our latest analysis for IVE Group
While markets are a powerful pricing mechanism, share prices reflect investor sentiment, not just underlying business performance. By comparing earnings per share (EPS) and share price changes over time, we can get a feel for how investor attitudes to a company have morphed over time.
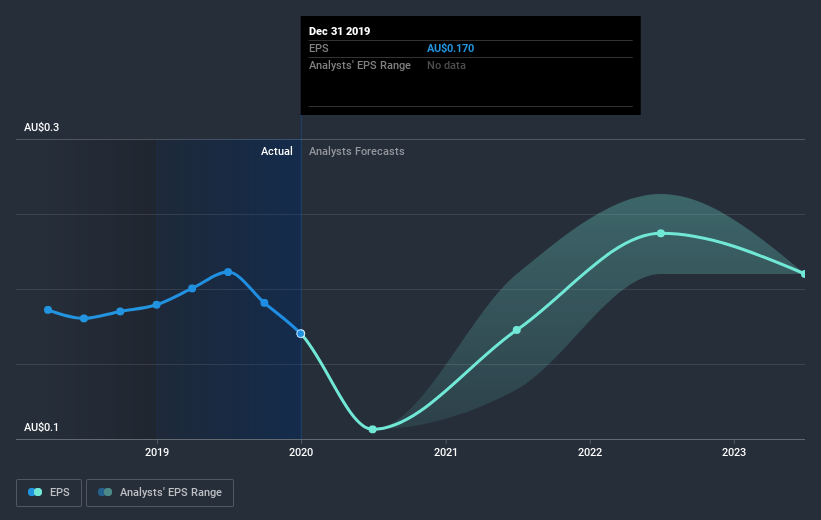
During the three years that the share price fell, IVE Group's earnings per share (EPS) dropped by 7.5% each year. This reduction in EPS is slower than the 30% annual reduction in the share price. So it seems the market was too confident about the business, in the past. The less favorable sentiment is reflected in its current P/E ratio of 4.52.
The image below shows how EPS has tracked over time (if you click on the image you can see greater detail).
It's probably worth noting we've seen significant insider buying in the last quarter, which we consider a positive. That said, we think earnings and revenue growth trends are even more important factors to consider. Dive deeper into the earnings by checking this interactive graph of IVE Group's earnings, revenue and cash flow.
What about the Total Shareholder Return (TSR)?
We'd be remiss not to mention the difference between IVE Group's total shareholder return (TSR) and its share price return. Arguably the TSR is a more complete return calculation because it accounts for the value of dividends (as if they were reinvested), along with the hypothetical value of any discounted capital that have been offered to shareholders. Dividends have been really beneficial for IVE Group shareholders, and that cash payout explains why its total shareholder loss of 59%, over the last 3 years, isn't as bad as the share price return.
A Different Perspective
IVE Group shareholders are down 62% for the year, falling short of the market return. The market shed around 7.5%, no doubt weighing on the stock price. The three-year loss of 17% per year isn't as bad as the last twelve months, suggesting that the company has not been able to convince the market it has solved its problems. We would be wary of buying into a company with unsolved problems, although some investors will buy into struggling stocks if they believe the price is sufficiently attractive. It's always interesting to track share price performance over the longer term. But to understand IVE Group better, we need to consider many other factors. Consider for instance, the ever-present spectre of investment risk. We've identified 3 warning signs with IVE Group , and understanding them should be part of your investment process.
IVE Group is not the only stock insiders are buying. So take a peek at this free list of growing companies with insider buying.
Please note, the market returns quoted in this article reflect the market weighted average returns of stocks that currently trade on AU exchanges.
This article by Simply Wall St is general in nature. It does not constitute a recommendation to buy or sell any stock, and does not take account of your objectives, or your financial situation. We aim to bring you long-term focused analysis driven by fundamental data. Note that our analysis may not factor in the latest price-sensitive company announcements or qualitative material. Simply Wall St has no position in any stocks mentioned.
Have feedback on this article? Concerned about the content? Get in touch with us directly. Alternatively, email editorial-team@simplywallst.com.
