
 Yahoo Finance
 Would Shareholders Who Purchased Australian Pharmaceutical Industries' (ASX:API) Stock Five Years Be Happy With The Share price Today?
While it may not be enough for some shareholders, we think it is good to see the Australian Pharmaceutical Industries Limited (ASX:API) share price up 19% in a single quarter. But that doesn't change the fact that the returns over the last five years have been less than pleasing. In fact, the share price is down 37%, which falls well short of the return you could get by buying an index fund.
See our latest analysis for Australian Pharmaceutical Industries
There is no denying that markets are sometimes efficient, but prices do not always reflect underlying business performance. By comparing earnings per share (EPS) and share price changes over time, we can get a feel for how investor attitudes to a company have morphed over time.
In the last half decade Australian Pharmaceutical Industries saw its share price fall as its EPS declined below zero. This was, in part, due to extraordinary items impacting earnings. Since the company has fallen to a loss making position, it's hard to compare the change in EPS with the share price change. But we would generally expect a lower price, given the situation.
The company's earnings per share (over time) is depicted in the image below (click to see the exact numbers).
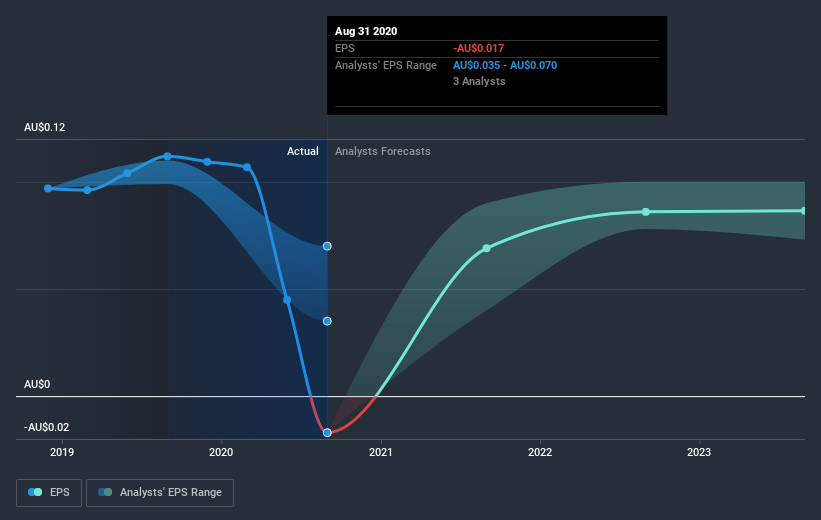
This free interactive report on Australian Pharmaceutical Industries' earnings, revenue and cash flow is a great place to start, if you want to investigate the stock further.
What About Dividends?
When looking at investment returns, it is important to consider the difference between total shareholder return (TSR) and share price return. The TSR is a return calculation that accounts for the value of cash dividends (assuming that any dividend received was reinvested) and the calculated value of any discounted capital raisings and spin-offs. It's fair to say that the TSR gives a more complete picture for stocks that pay a dividend. In the case of Australian Pharmaceutical Industries, it has a TSR of -23% for the last 5 years. That exceeds its share price return that we previously mentioned. This is largely a result of its dividend payments!
A Different Perspective
While the broader market gained around 5.2% in the last year, Australian Pharmaceutical Industries shareholders lost 8.2% (even including dividends). However, keep in mind that even the best stocks will sometimes underperform the market over a twelve month period. Regrettably, last year's performance caps off a bad run, with the shareholders facing a total loss of 4% per year over five years. Generally speaking long term share price weakness can be a bad sign, though contrarian investors might want to research the stock in hope of a turnaround. If you would like to research Australian Pharmaceutical Industries in more detail then you might want to take a look at whether insiders have been buying or selling shares in the company.
If you are like me, then you will not want to miss this free list of growing companies that insiders are buying.
Please note, the market returns quoted in this article reflect the market weighted average returns of stocks that currently trade on AU exchanges.
This article by Simply Wall St is general in nature. It does not constitute a recommendation to buy or sell any stock, and does not take account of your objectives, or your financial situation. We aim to bring you long-term focused analysis driven by fundamental data. Note that our analysis may not factor in the latest price-sensitive company announcements or qualitative material. Simply Wall St has no position in any stocks mentioned.
Have feedback on this article? Concerned about the content? Get in touch with us directly. Alternatively, email editorial-team (at) simplywallst.com.
