
 Yahoo Finance
 Shareholders in MedAdvisor (ASX:MDR) are in the red if they invested five years ago
In order to justify the effort of selecting individual stocks, it's worth striving to beat the returns from a market index fund. But the main game is to find enough winners to more than offset the losers At this point some shareholders may be questioning their investment in MedAdvisor Limited (ASX:MDR), since the last five years saw the share price fall 31%.
It's worthwhile assessing if the company's economics have been moving in lockstep with these underwhelming shareholder returns, or if there is some disparity between the two. So let's do just that.
See our latest analysis for MedAdvisor
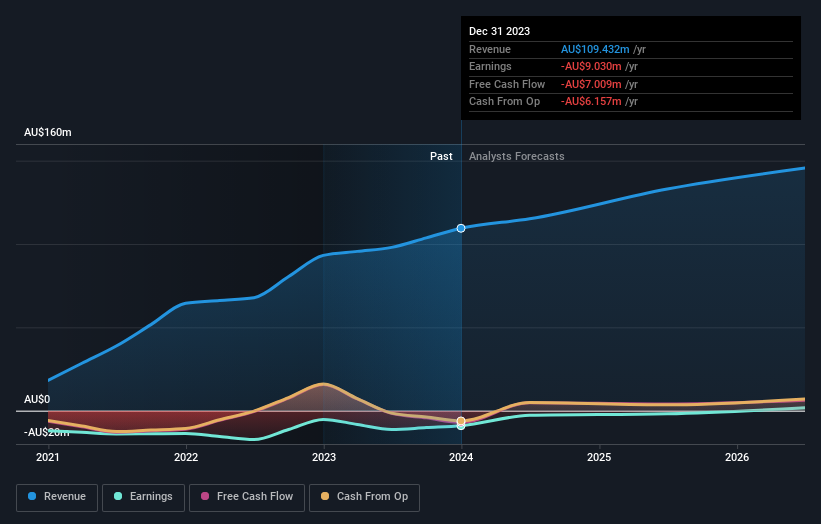
MedAdvisor wasn't profitable in the last twelve months, it is unlikely we'll see a strong correlation between its share price and its earnings per share (EPS). Arguably revenue is our next best option. When a company doesn't make profits, we'd generally hope to see good revenue growth. That's because fast revenue growth can be easily extrapolated to forecast profits, often of considerable size.
In the last half decade, MedAdvisor saw its revenue increase by 51% per year. That's better than most loss-making companies. Shareholders are no doubt disappointed with the loss of 6%, each year, in that time. So you might argue the MedAdvisor should get more credit for its rather impressive revenue growth over the period. So now is probably an apt time to look closer at the stock, if you think it has potential.
The company's revenue and earnings (over time) are depicted in the image below (click to see the exact numbers).
We consider it positive that insiders have made significant purchases in the last year. Having said that, most people consider earnings and revenue growth trends to be a more meaningful guide to the business. If you are thinking of buying or selling MedAdvisor stock, you should check out this free report showing analyst profit forecasts.
A Different Perspective
While the broader market gained around 13% in the last year, MedAdvisor shareholders lost 7.4%. However, keep in mind that even the best stocks will sometimes underperform the market over a twelve month period. Regrettably, last year's performance caps off a bad run, with the shareholders facing a total loss of 5% per year over five years. Generally speaking long term share price weakness can be a bad sign, though contrarian investors might want to research the stock in hope of a turnaround. While it is well worth considering the different impacts that market conditions can have on the share price, there are other factors that are even more important. To that end, you should be aware of the 2 warning signs we've spotted with MedAdvisor .
MedAdvisor is not the only stock insiders are buying. So take a peek at this free list of growing companies with insider buying.
Please note, the market returns quoted in this article reflect the market weighted average returns of stocks that currently trade on Australian exchanges.
Have feedback on this article? Concerned about the content? Get in touch with us directly. Alternatively, email editorial-team (at) simplywallst.com.
This article by Simply Wall St is general in nature. We provide commentary based on historical data and analyst forecasts only using an unbiased methodology and our articles are not intended to be financial advice. It does not constitute a recommendation to buy or sell any stock, and does not take account of your objectives, or your financial situation. We aim to bring you long-term focused analysis driven by fundamental data. Note that our analysis may not factor in the latest price-sensitive company announcements or qualitative material. Simply Wall St has no position in any stocks mentioned.
