
 Yahoo Finance
 Shareholders in Gooch & Housego (LON:GHH) are in the red if they invested five years ago
Generally speaking long term investing is the way to go. But unfortunately, some companies simply don't succeed. To wit, the Gooch & Housego PLC (LON:GHH) share price managed to fall 61% over five long years. That is extremely sub-optimal, to say the least. The falls have accelerated recently, with the share price down 13% in the last three months.
Since shareholders are down over the longer term, lets look at the underlying fundamentals over the that time and see if they've been consistent with returns.
Check out our latest analysis for Gooch & Housego
To quote Buffett, 'Ships will sail around the world but the Flat Earth Society will flourish. There will continue to be wide discrepancies between price and value in the marketplace...' One way to examine how market sentiment has changed over time is to look at the interaction between a company's share price and its earnings per share (EPS).
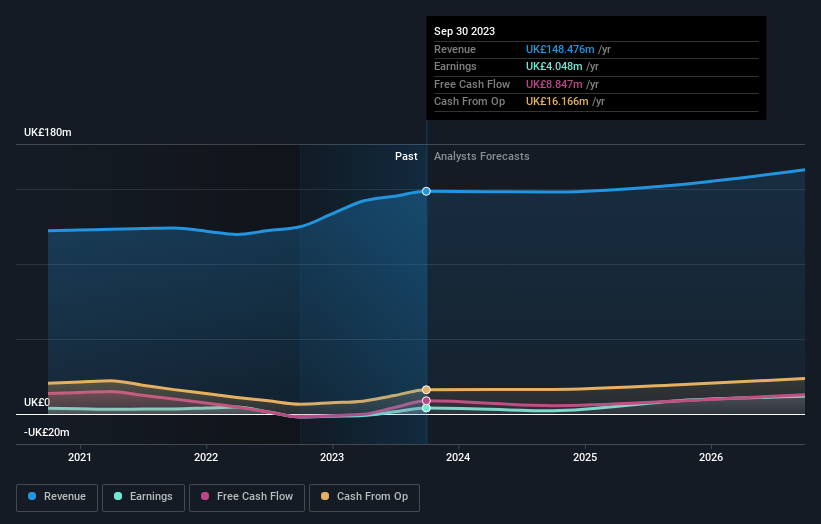
During five years of share price growth, Gooch & Housego moved from a loss to profitability. That would generally be considered a positive, so we are surprised to see the share price is down. Other metrics may better explain the share price move.
In contrast to the share price, revenue has actually increased by 1.8% a year in the five year period. So it seems one might have to take closer look at the fundamentals to understand why the share price languishes. After all, there may be an opportunity.
You can see how earnings and revenue have changed over time in the image below (click on the chart to see the exact values).
We know that Gooch & Housego has improved its bottom line lately, but what does the future have in store? So we recommend checking out this free report showing consensus forecasts
What About Dividends?
As well as measuring the share price return, investors should also consider the total shareholder return (TSR). The TSR incorporates the value of any spin-offs or discounted capital raisings, along with any dividends, based on the assumption that the dividends are reinvested. So for companies that pay a generous dividend, the TSR is often a lot higher than the share price return. In the case of Gooch & Housego, it has a TSR of -58% for the last 5 years. That exceeds its share price return that we previously mentioned. And there's no prize for guessing that the dividend payments largely explain the divergence!
A Different Perspective
It's nice to see that Gooch & Housego shareholders have received a total shareholder return of 21% over the last year. That's including the dividend. There's no doubt those recent returns are much better than the TSR loss of 10% per year over five years. This makes us a little wary, but the business might have turned around its fortunes. While it is well worth considering the different impacts that market conditions can have on the share price, there are other factors that are even more important. Consider risks, for instance. Every company has them, and we've spotted 2 warning signs for Gooch & Housego you should know about.
If you would prefer to check out another company -- one with potentially superior financials -- then do not miss this free list of companies that have proven they can grow earnings.
Please note, the market returns quoted in this article reflect the market weighted average returns of stocks that currently trade on British exchanges.
Have feedback on this article? Concerned about the content? Get in touch with us directly. Alternatively, email editorial-team (at) simplywallst.com.
This article by Simply Wall St is general in nature. We provide commentary based on historical data and analyst forecasts only using an unbiased methodology and our articles are not intended to be financial advice. It does not constitute a recommendation to buy or sell any stock, and does not take account of your objectives, or your financial situation. We aim to bring you long-term focused analysis driven by fundamental data. Note that our analysis may not factor in the latest price-sensitive company announcements or qualitative material. Simply Wall St has no position in any stocks mentioned.
