
 Yahoo Finance
 Shareholders have faith in loss-making Proteomics International Laboratories (ASX:PIQ) as stock climbs 11% in past week, taking five-year gain to 510%
For many, the main point of investing in the stock market is to achieve spectacular returns. And highest quality companies can see their share prices grow by huge amounts. Don't believe it? Then look at the Proteomics International Laboratories Limited (ASX:PIQ) share price. It's 510% higher than it was five years ago. This just goes to show the value creation that some businesses can achieve. Also pleasing for shareholders was the 33% gain in the last three months. It really delights us to see such great share price performance for investors.
On the back of a solid 7-day performance, let's check what role the company's fundamentals have played in driving long term shareholder returns.
See our latest analysis for Proteomics International Laboratories
Proteomics International Laboratories isn't currently profitable, so most analysts would look to revenue growth to get an idea of how fast the underlying business is growing. When a company doesn't make profits, we'd generally expect to see good revenue growth. That's because fast revenue growth can be easily extrapolated to forecast profits, often of considerable size.
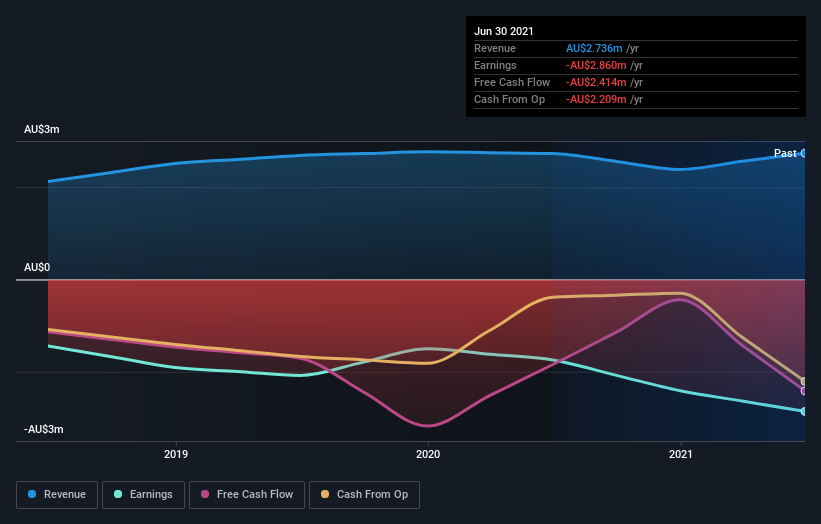
In the last 5 years Proteomics International Laboratories saw its revenue grow at 12% per year. That's a pretty good long term growth rate. Arguably it's more than reflected in the very strong share price gain of 44% a year over a half a decade. It might not be cheap but a (long-term) growth stock like this is usually well worth taking a closer look at.
The image below shows how earnings and revenue have tracked over time (if you click on the image you can see greater detail).
This free interactive report on Proteomics International Laboratories' balance sheet strength is a great place to start, if you want to investigate the stock further.
A Different Perspective
We're pleased to report that Proteomics International Laboratories shareholders have received a total shareholder return of 16% over one year. However, the TSR over five years, coming in at 44% per year, is even more impressive. Potential buyers might understandably feel they've missed the opportunity, but it's always possible business is still firing on all cylinders. It's always interesting to track share price performance over the longer term. But to understand Proteomics International Laboratories better, we need to consider many other factors. To that end, you should learn about the 4 warning signs we've spotted with Proteomics International Laboratories (including 1 which shouldn't be ignored) .
Of course Proteomics International Laboratories may not be the best stock to buy. So you may wish to see this free collection of growth stocks.
Please note, the market returns quoted in this article reflect the market weighted average returns of stocks that currently trade on AU exchanges.
Have feedback on this article? Concerned about the content? Get in touch with us directly. Alternatively, email editorial-team (at) simplywallst.com.
This article by Simply Wall St is general in nature. We provide commentary based on historical data and analyst forecasts only using an unbiased methodology and our articles are not intended to be financial advice. It does not constitute a recommendation to buy or sell any stock, and does not take account of your objectives, or your financial situation. We aim to bring you long-term focused analysis driven by fundamental data. Note that our analysis may not factor in the latest price-sensitive company announcements or qualitative material. Simply Wall St has no position in any stocks mentioned.
