
 Yahoo Finance
 Shareholders Would Enjoy A Repeat Of CorVel's (NASDAQ:CRVL) Recent Growth In Returns
If you're not sure where to start when looking for the next multi-bagger, there are a few key trends you should keep an eye out for. Ideally, a business will show two trends; firstly a growing return on capital employed (ROCE) and secondly, an increasing amount of capital employed. Ultimately, this demonstrates that it's a business that is reinvesting profits at increasing rates of return. So when we looked at the ROCE trend of CorVel (NASDAQ:CRVL) we really liked what we saw.
Return On Capital Employed (ROCE): What Is It?
For those who don't know, ROCE is a measure of a company's yearly pre-tax profit (its return), relative to the capital employed in the business. The formula for this calculation on CorVel is:
Return on Capital Employed = Earnings Before Interest and Tax (EBIT) ÷ (Total Assets - Current Liabilities)
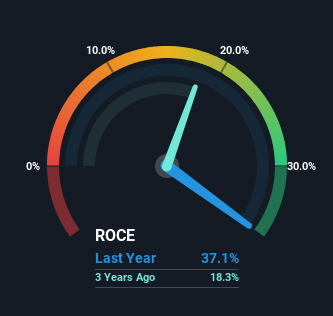
0.37 = US$95m ÷ (US$445m - US$188m) (Based on the trailing twelve months to December 2023).
So, CorVel has an ROCE of 37%. That's a fantastic return and not only that, it outpaces the average of 11% earned by companies in a similar industry.
See our latest analysis for CorVel
While the past is not representative of the future, it can be helpful to know how a company has performed historically, which is why we have this chart above. If you want to delve into the historical earnings , check out these free graphs detailing revenue and cash flow performance of CorVel.
What The Trend Of ROCE Can Tell Us
Investors would be pleased with what's happening at CorVel. The data shows that returns on capital have increased substantially over the last five years to 37%. Basically the business is earning more per dollar of capital invested and in addition to that, 31% more capital is being employed now too. This can indicate that there's plenty of opportunities to invest capital internally and at ever higher rates, a combination that's common among multi-baggers.
Another thing to note, CorVel has a high ratio of current liabilities to total assets of 42%. This can bring about some risks because the company is basically operating with a rather large reliance on its suppliers or other sorts of short-term creditors. While it's not necessarily a bad thing, it can be beneficial if this ratio is lower.
The Key Takeaway
To sum it up, CorVel has proven it can reinvest in the business and generate higher returns on that capital employed, which is terrific. Since the stock has returned a staggering 287% to shareholders over the last five years, it looks like investors are recognizing these changes. In light of that, we think it's worth looking further into this stock because if CorVel can keep these trends up, it could have a bright future ahead.
If you want to continue researching CorVel, you might be interested to know about the 1 warning sign that our analysis has discovered.
CorVel is not the only stock earning high returns. If you'd like to see more, check out our free list of companies earning high returns on equity with solid fundamentals.
Have feedback on this article? Concerned about the content? Get in touch with us directly. Alternatively, email editorial-team (at) simplywallst.com.
This article by Simply Wall St is general in nature. We provide commentary based on historical data and analyst forecasts only using an unbiased methodology and our articles are not intended to be financial advice. It does not constitute a recommendation to buy or sell any stock, and does not take account of your objectives, or your financial situation. We aim to bring you long-term focused analysis driven by fundamental data. Note that our analysis may not factor in the latest price-sensitive company announcements or qualitative material. Simply Wall St has no position in any stocks mentioned.
