
 Yahoo Finance
 Shareholders in BCB Bancorp (NASDAQ:BCBP) are in the red if they invested a year ago
Investors can approximate the average market return by buying an index fund. When you buy individual stocks, you can make higher profits, but you also face the risk of under-performance. Investors in BCB Bancorp, Inc. (NASDAQ:BCBP) have tasted that bitter downside in the last year, as the share price dropped 39%. That falls noticeably short of the market return of around 27%. However, the longer term returns haven't been so bad, with the stock down 24% in the last three years. Unfortunately the share price momentum is still quite negative, with prices down 21% in thirty days.
Now let's have a look at the company's fundamentals, and see if the long term shareholder return has matched the performance of the underlying business.
Check out our latest analysis for BCB Bancorp
There is no denying that markets are sometimes efficient, but prices do not always reflect underlying business performance. By comparing earnings per share (EPS) and share price changes over time, we can get a feel for how investor attitudes to a company have morphed over time.
Unhappily, BCB Bancorp had to report a 35% decline in EPS over the last year. This proportional reduction in earnings per share isn't far from the 39% decrease in the share price. Given the lower EPS we might have expected investors to lose confidence in the stock, but that doesn't seemed to have happened. Instead, the change in the share price seems to reduction in earnings per share, alone.
You can see how EPS has changed over time in the image below (click on the chart to see the exact values).
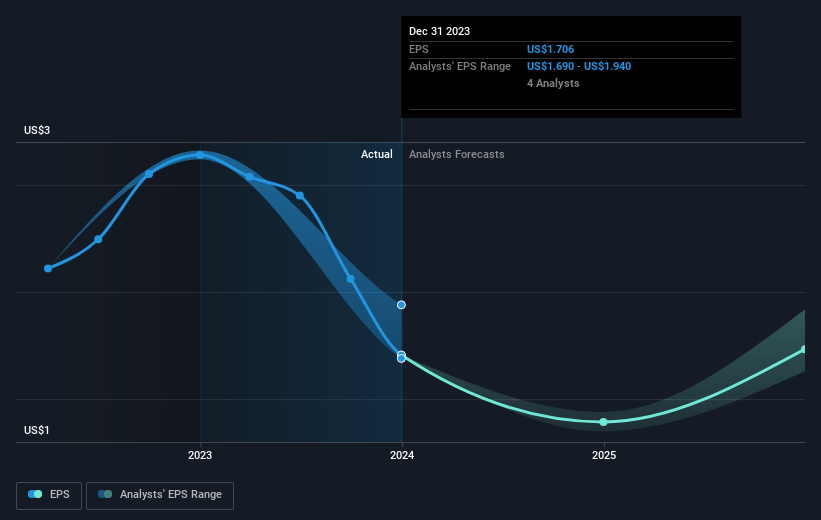
We consider it positive that insiders have made significant purchases in the last year. Having said that, most people consider earnings and revenue growth trends to be a more meaningful guide to the business. It might be well worthwhile taking a look at our free report on BCB Bancorp's earnings, revenue and cash flow.
What About Dividends?
As well as measuring the share price return, investors should also consider the total shareholder return (TSR). The TSR is a return calculation that accounts for the value of cash dividends (assuming that any dividend received was reinvested) and the calculated value of any discounted capital raisings and spin-offs. It's fair to say that the TSR gives a more complete picture for stocks that pay a dividend. In the case of BCB Bancorp, it has a TSR of -36% for the last 1 year. That exceeds its share price return that we previously mentioned. And there's no prize for guessing that the dividend payments largely explain the divergence!
A Different Perspective
While the broader market gained around 27% in the last year, BCB Bancorp shareholders lost 36% (even including dividends). However, keep in mind that even the best stocks will sometimes underperform the market over a twelve month period. On the bright side, long term shareholders have made money, with a gain of 0.3% per year over half a decade. It could be that the recent sell-off is an opportunity, so it may be worth checking the fundamental data for signs of a long term growth trend. If you want to research this stock further, the data on insider buying is an obvious place to start. You can click here to see who has been buying shares - and the price they paid.
If you like to buy stocks alongside management, then you might just love this free list of companies. (Hint: insiders have been buying them).
Please note, the market returns quoted in this article reflect the market weighted average returns of stocks that currently trade on American exchanges.
Have feedback on this article? Concerned about the content? Get in touch with us directly. Alternatively, email editorial-team (at) simplywallst.com.
This article by Simply Wall St is general in nature. We provide commentary based on historical data and analyst forecasts only using an unbiased methodology and our articles are not intended to be financial advice. It does not constitute a recommendation to buy or sell any stock, and does not take account of your objectives, or your financial situation. We aim to bring you long-term focused analysis driven by fundamental data. Note that our analysis may not factor in the latest price-sensitive company announcements or qualitative material. Simply Wall St has no position in any stocks mentioned.
