
 Yahoo Finance
 Share Price Aside, Orora (ASX:ORA) Has Delivered Shareholders A 4.0% Return.
Orora Limited (ASX:ORA) shareholders should be happy to see the share price up 14% in the last quarter. But that doesn't help the fact that the three year return is less impressive. After all, the share price is down 25% in the last three years, significantly under-performing the market.
View our latest analysis for Orora
In his essay The Superinvestors of Graham-and-Doddsville Warren Buffett described how share prices do not always rationally reflect the value of a business. One imperfect but simple way to consider how the market perception of a company has shifted is to compare the change in the earnings per share (EPS) with the share price movement.
During the three years that the share price fell, Orora's earnings per share (EPS) dropped by 42% each year. This fall in the EPS is worse than the 9% compound annual share price fall. So the market may not be too worried about the EPS figure, at the moment -- or it may have previously priced some of the drop in. With a P/E ratio of 83.05, it's fair to say the market sees a brighter future for the business.
The company's earnings per share (over time) is depicted in the image below (click to see the exact numbers).
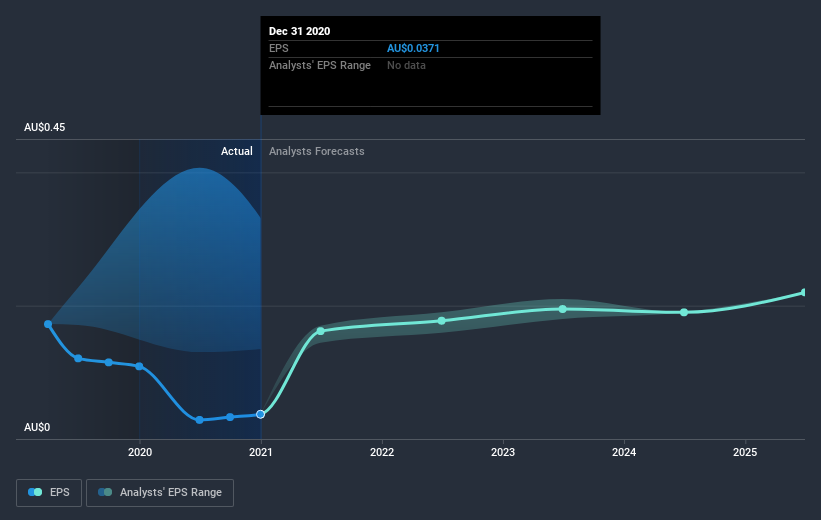
Dive deeper into Orora's key metrics by checking this interactive graph of Orora's earnings, revenue and cash flow.
What About Dividends?
As well as measuring the share price return, investors should also consider the total shareholder return (TSR). The TSR incorporates the value of any spin-offs or discounted capital raisings, along with any dividends, based on the assumption that the dividends are reinvested. So for companies that pay a generous dividend, the TSR is often a lot higher than the share price return. We note that for Orora the TSR over the last 3 years was 4.0%, which is better than the share price return mentioned above. And there's no prize for guessing that the dividend payments largely explain the divergence!
A Different Perspective
Orora shareholders are up 23% for the year (even including dividends). Unfortunately this falls short of the market return. On the bright side, that's still a gain, and it's actually better than the average return of 8% over half a decade This could indicate that the company is winning over new investors, as it pursues its strategy. While it is well worth considering the different impacts that market conditions can have on the share price, there are other factors that are even more important. Consider risks, for instance. Every company has them, and we've spotted 3 warning signs for Orora you should know about.
If you like to buy stocks alongside management, then you might just love this free list of companies. (Hint: insiders have been buying them).
Please note, the market returns quoted in this article reflect the market weighted average returns of stocks that currently trade on AU exchanges.
This article by Simply Wall St is general in nature. It does not constitute a recommendation to buy or sell any stock, and does not take account of your objectives, or your financial situation. We aim to bring you long-term focused analysis driven by fundamental data. Note that our analysis may not factor in the latest price-sensitive company announcements or qualitative material. Simply Wall St has no position in any stocks mentioned.
Have feedback on this article? Concerned about the content? Get in touch with us directly. Alternatively, email editorial-team (at) simplywallst.com.
