
 Yahoo Finance
 SFS Group Full Year 2023 Earnings: Misses Expectations
SFS Group (VTX:SFSN) Full Year 2023 Results
Key Financial Results
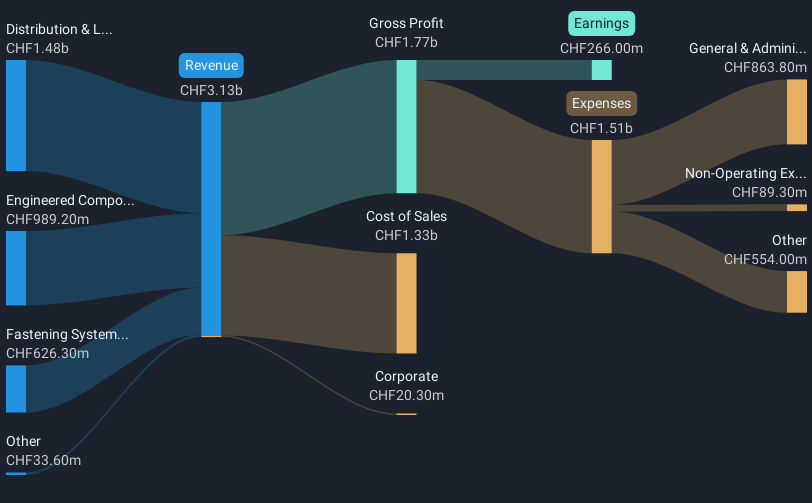
Revenue: CHF3.11b (up 12% from FY 2022).
Net income: CHF266.0m (flat on FY 2022).
Profit margin: 8.6% (down from 9.6% in FY 2022). The decrease in margin was driven by higher expenses.
EPS: CHF6.84 (down from CHF6.95 in FY 2022).
All figures shown in the chart above are for the trailing 12 month (TTM) period
SFS Group Revenues and Earnings Miss Expectations
Revenue missed analyst estimates by 2.3%. Earnings per share (EPS) also missed analyst estimates by 2.7%.
The primary driver behind last 12 months revenue was the Distribution & Logistics segment contributing a total revenue of CHF1.48b (48% of total revenue). The largest operating expense was General & Administrative costs, amounting to CHF863.8m (57% of total expenses). Explore how SFSN's revenue and expenses shape its earnings.
Looking ahead, revenue is forecast to grow 2.2% p.a. on average during the next 3 years, compared to a 5.8% growth forecast for the Machinery industry in Switzerland.
Performance of the Swiss Machinery industry.
The company's shares are up 1.6% from a week ago.
Risk Analysis
It's still necessary to consider the ever-present spectre of investment risk. We've identified 1 warning sign with SFS Group, and understanding this should be part of your investment process.
Have feedback on this article? Concerned about the content? Get in touch with us directly. Alternatively, email editorial-team (at) simplywallst.com.
This article by Simply Wall St is general in nature. We provide commentary based on historical data and analyst forecasts only using an unbiased methodology and our articles are not intended to be financial advice. It does not constitute a recommendation to buy or sell any stock, and does not take account of your objectives, or your financial situation. We aim to bring you long-term focused analysis driven by fundamental data. Note that our analysis may not factor in the latest price-sensitive company announcements or qualitative material. Simply Wall St has no position in any stocks mentioned.
