
 Yahoo Finance
 Serabi Gold (LON:SRB) shareholders have earned a 62% return over the last year
Passive investing in index funds can generate returns that roughly match the overall market. But you can significantly boost your returns by picking above-average stocks. To wit, the Serabi Gold plc (LON:SRB) share price is 62% higher than it was a year ago, much better than the market decline of around 7.1% (not including dividends) in the same period. So that should have shareholders smiling. In contrast, the longer term returns are negative, since the share price is 40% lower than it was three years ago.
Let's take a look at the underlying fundamentals over the longer term, and see if they've been consistent with shareholders returns.
Check out our latest analysis for Serabi Gold
While the efficient markets hypothesis continues to be taught by some, it has been proven that markets are over-reactive dynamic systems, and investors are not always rational. One way to examine how market sentiment has changed over time is to look at the interaction between a company's share price and its earnings per share (EPS).
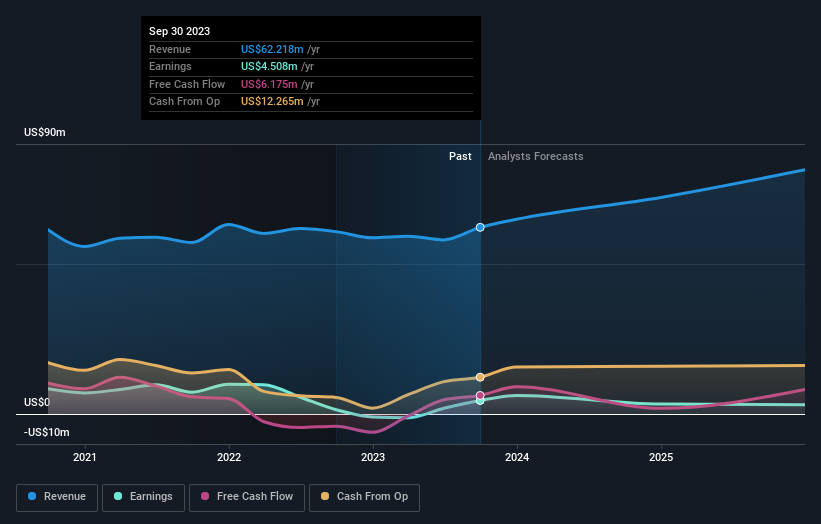
Serabi Gold went from making a loss to reporting a profit, in the last year.
When a company is just on the edge of profitability it can be well worth considering other metrics in order to more precisely gauge growth (and therefore understand share price movements).
Revenue was pretty flat year on year, but maybe a closer look at the data can explain the market optimism.
The graphic below depicts how earnings and revenue have changed over time (unveil the exact values by clicking on the image).
We know that Serabi Gold has improved its bottom line lately, but what does the future have in store? If you are thinking of buying or selling Serabi Gold stock, you should check out this free report showing analyst profit forecasts.
A Different Perspective
It's good to see that Serabi Gold has rewarded shareholders with a total shareholder return of 62% in the last twelve months. That's better than the annualised return of 7% over half a decade, implying that the company is doing better recently. Someone with an optimistic perspective could view the recent improvement in TSR as indicating that the business itself is getting better with time. I find it very interesting to look at share price over the long term as a proxy for business performance. But to truly gain insight, we need to consider other information, too. To that end, you should learn about the 3 warning signs we've spotted with Serabi Gold (including 2 which shouldn't be ignored) .
We will like Serabi Gold better if we see some big insider buys. While we wait, check out this free list of growing companies with considerable, recent, insider buying.
Please note, the market returns quoted in this article reflect the market weighted average returns of stocks that currently trade on British exchanges.
Have feedback on this article? Concerned about the content? Get in touch with us directly. Alternatively, email editorial-team (at) simplywallst.com.
This article by Simply Wall St is general in nature. We provide commentary based on historical data and analyst forecasts only using an unbiased methodology and our articles are not intended to be financial advice. It does not constitute a recommendation to buy or sell any stock, and does not take account of your objectives, or your financial situation. We aim to bring you long-term focused analysis driven by fundamental data. Note that our analysis may not factor in the latest price-sensitive company announcements or qualitative material. Simply Wall St has no position in any stocks mentioned.
