
 Yahoo Finance
 Sequoia Financial Group (ASX:SEQ) rallies 13% this week, taking five-year gains to 116%
When we invest, we're generally looking for stocks that outperform the market average. Buying under-rated businesses is one path to excess returns. For example, the Sequoia Financial Group Limited (ASX:SEQ) share price is up 87% in the last 5 years, clearly besting the market return of around 20% (ignoring dividends). However, more recent returns haven't been as impressive as that, with the stock returning just 13% in the last year , including dividends .
The past week has proven to be lucrative for Sequoia Financial Group investors, so let's see if fundamentals drove the company's five-year performance.
View our latest analysis for Sequoia Financial Group
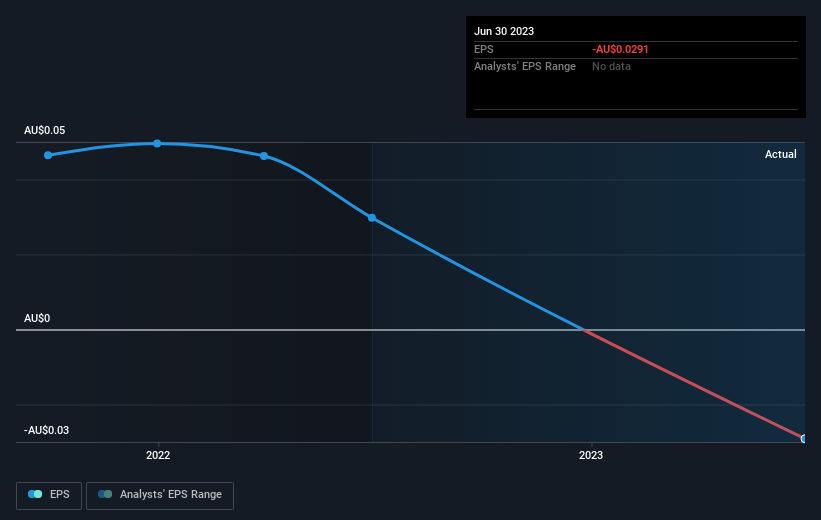
While markets are a powerful pricing mechanism, share prices reflect investor sentiment, not just underlying business performance. One imperfect but simple way to consider how the market perception of a company has shifted is to compare the change in the earnings per share (EPS) with the share price movement.
Over half a decade, Sequoia Financial Group managed to grow its earnings per share at 18% a year. This EPS growth is higher than the 13% average annual increase in the share price. So it seems the market isn't so enthusiastic about the stock these days.
The graphic below depicts how EPS has changed over time (unveil the exact values by clicking on the image).
Before buying or selling a stock, we always recommend a close examination of historic growth trends, available here.
What About The Total Shareholder Return (TSR)?
Investors should note that there's a difference between Sequoia Financial Group's total shareholder return (TSR) and its share price change, which we've covered above. The TSR attempts to capture the value of dividends (as if they were reinvested) as well as any spin-offs or discounted capital raisings offered to shareholders. Dividends have been really beneficial for Sequoia Financial Group shareholders, and that cash payout contributed to why its TSR of 116%, over the last 5 years, is better than the share price return.
A Different Perspective
We're pleased to report that Sequoia Financial Group shareholders have received a total shareholder return of 13% over one year. However, that falls short of the 17% TSR per annum it has made for shareholders, each year, over five years. I find it very interesting to look at share price over the long term as a proxy for business performance. But to truly gain insight, we need to consider other information, too. Consider for instance, the ever-present spectre of investment risk. We've identified 1 warning sign with Sequoia Financial Group , and understanding them should be part of your investment process.
Of course Sequoia Financial Group may not be the best stock to buy. So you may wish to see this free collection of growth stocks.
Please note, the market returns quoted in this article reflect the market weighted average returns of stocks that currently trade on Australian exchanges.
Have feedback on this article? Concerned about the content? Get in touch with us directly. Alternatively, email editorial-team (at) simplywallst.com.
This article by Simply Wall St is general in nature. We provide commentary based on historical data and analyst forecasts only using an unbiased methodology and our articles are not intended to be financial advice. It does not constitute a recommendation to buy or sell any stock, and does not take account of your objectives, or your financial situation. We aim to bring you long-term focused analysis driven by fundamental data. Note that our analysis may not factor in the latest price-sensitive company announcements or qualitative material. Simply Wall St has no position in any stocks mentioned.
